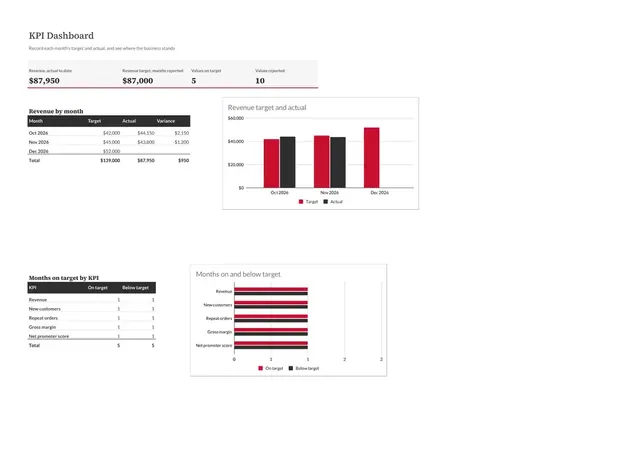
KPI Dashboard
Sheets + Excel3 slides
Free2 templates
Sheets + Excel3 slides
Free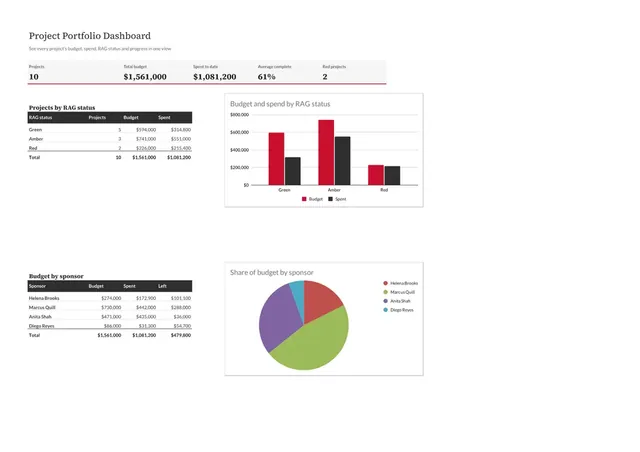
Sheets + Excel3 slides
Free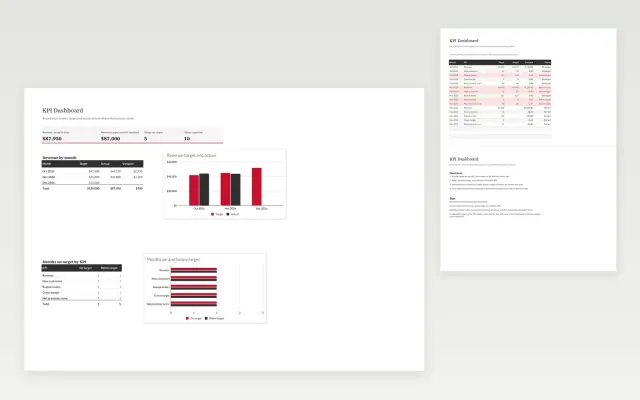 KPI Dashboard | 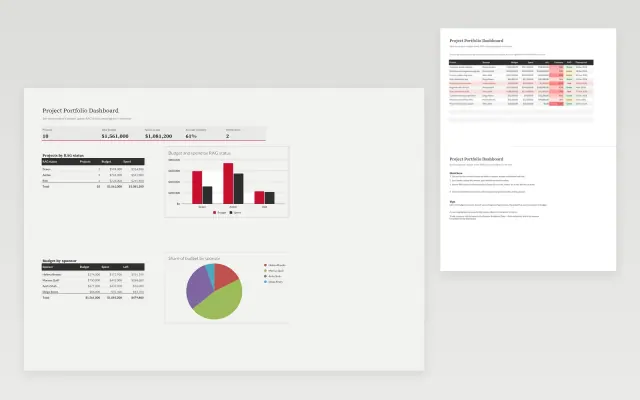 Project Portfolio Dashboard | |
|---|---|---|
| Format | Spreadsheet | Spreadsheet |
| Works in | Google Sheets and Excel | Google Sheets and Excel |
| Length | 3 slides | 3 slides |
| Style | Corporate | Corporate |
A dashboard puts the key numbers for a project, team or business on one page, so people can see performance at a glance. It works best when it is updated on a schedule and tied to clear targets.
Cover headline numbers, target for each measure, trend charts, status by project or team, owners, and last updated date.
Keep it to six to eight measures, and make each one answer a question that someone asks in a meeting.
Compare KPI Dashboard and Project Portfolio Dashboard, all 3 pages long, then pick the closest match and replace the sample text with your own.
A dashboard puts the key numbers for a project, team or business on one page, so people can see performance at a glance. It works best when it is updated on a schedule and tied to clear targets.
Include headline numbers, target for each measure, trend charts, status by project or team, owners, and last updated date. Keep it to six to eight measures, and make each one answer a question that someone asks in a meeting.
A key performance indicator is a measure of progress toward an important goal, such as monthly revenue or on-time delivery. Pick the few that link directly to your targets.
It shows all active projects together, with status, budget, schedule and risk on one page. Leaders use it to decide where to add people or stop work.
Update it as often as the decisions it supports need, usually weekly for projects and monthly for business measures. Always show the date of the last update.
Start with KPI Dashboard: Record monthly targets and actuals, flag misses and chart revenue against target. If that is not the right fit, compare it with Project Portfolio Dashboard.
The templates here are 3 pages long. Cut any section you do not need; each template explains what its sections are for.
Yes. These dashboard templates work in Google Sheets and Microsoft Excel. All 2 templates are free, with no account or email needed.