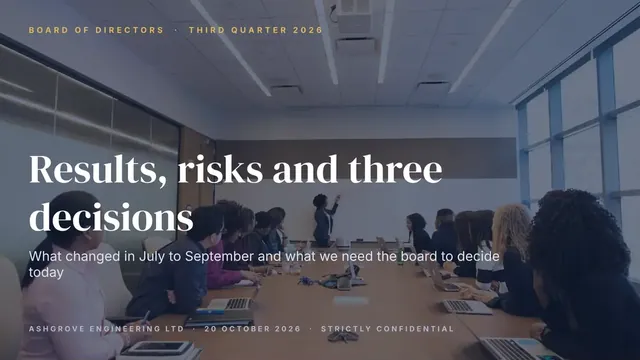
Board Meeting Deck
Slides + PowerPoint20 slides
Free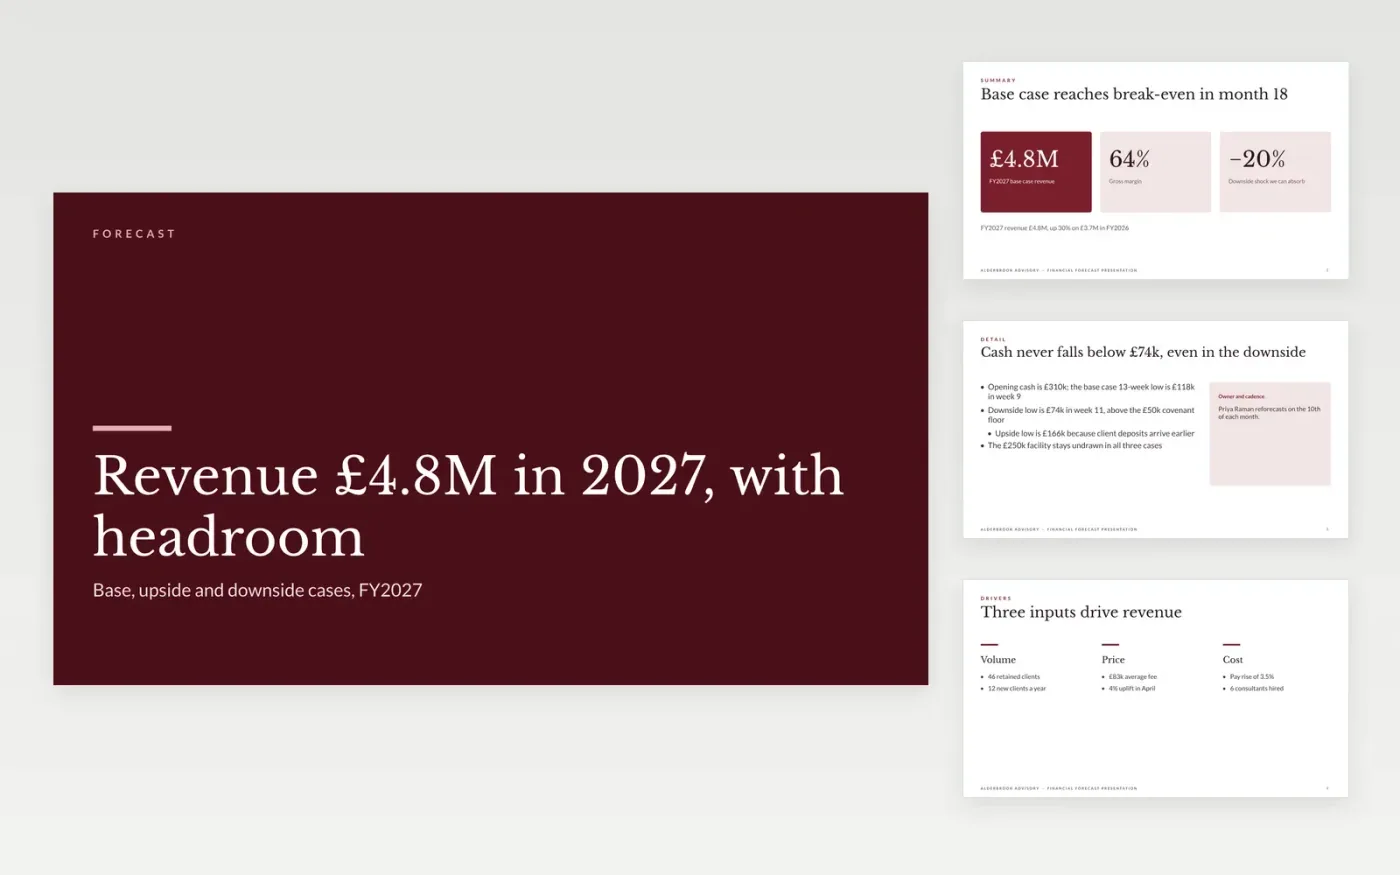
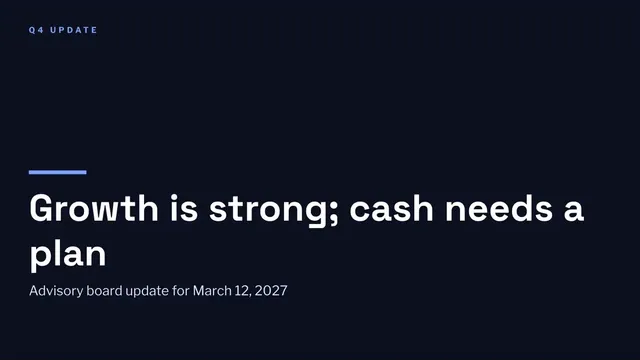
A forecast with one optimistic case invites doubt. This deck gives finance leads a structure that investors and lenders trust: headline outcomes first, then the drivers behind the revenue, the base case, the upside and the downside on separate slides, and finally the actions and owners. Every number sits beside the assumption that produced it.
The sample is a three-year forecast for Alderbrook Advisory, a fictional firm: £4.8M revenue in FY2027, 64% gross margin, EBITDA break-even in month 18, an upside of 15% and a downside of 20% with the lowest 13-week cash balance shown. Replace the client, fee and wage inputs, then the cases, the opening cash and the owners.
Click Make a copy in Google Slides, then confirm on the Google page. The copy is saved to your own Google Drive.
Replace the client count, average fee, wage and inflation inputs on the Drivers slides with your own assumptions.
Update the base case chart and the upside table from your model, and set the upside and downside percentages from what has moved in your market.
Enter your opening cash, covenant floor and 13-week low in the headroom bullets, and name an owner and a reforecast date.
Delete the Make it yours slide, then present the deck or share it as a Google Slides link or PDF.
Yes. It is a free Google Slides template. Make a copy to your own Google Drive, replace the sample figures with your own, then present or share it.
No. It presents the results of your model. Build the numbers in your spreadsheet, then copy the totals into the slides so they tie to your cash flow.
No. Alderbrook Advisory, its people and every figure in the deck are fictional sample data. Replace them all with your own numbers before you present.
Slides + PowerPoint20 slides
Free
Docs + Word17 pages
Free
Docs + Word6 pages
Free
Sheets + Excel4 slides
Free
Docs + Word7 pages
Free
Docs + Word7 pages
Free
Docs + Word8 pages
Free
Docs + Word8 pages
Free