Financial Forecast Presentation
Slides + PowerPoint11 slides
Free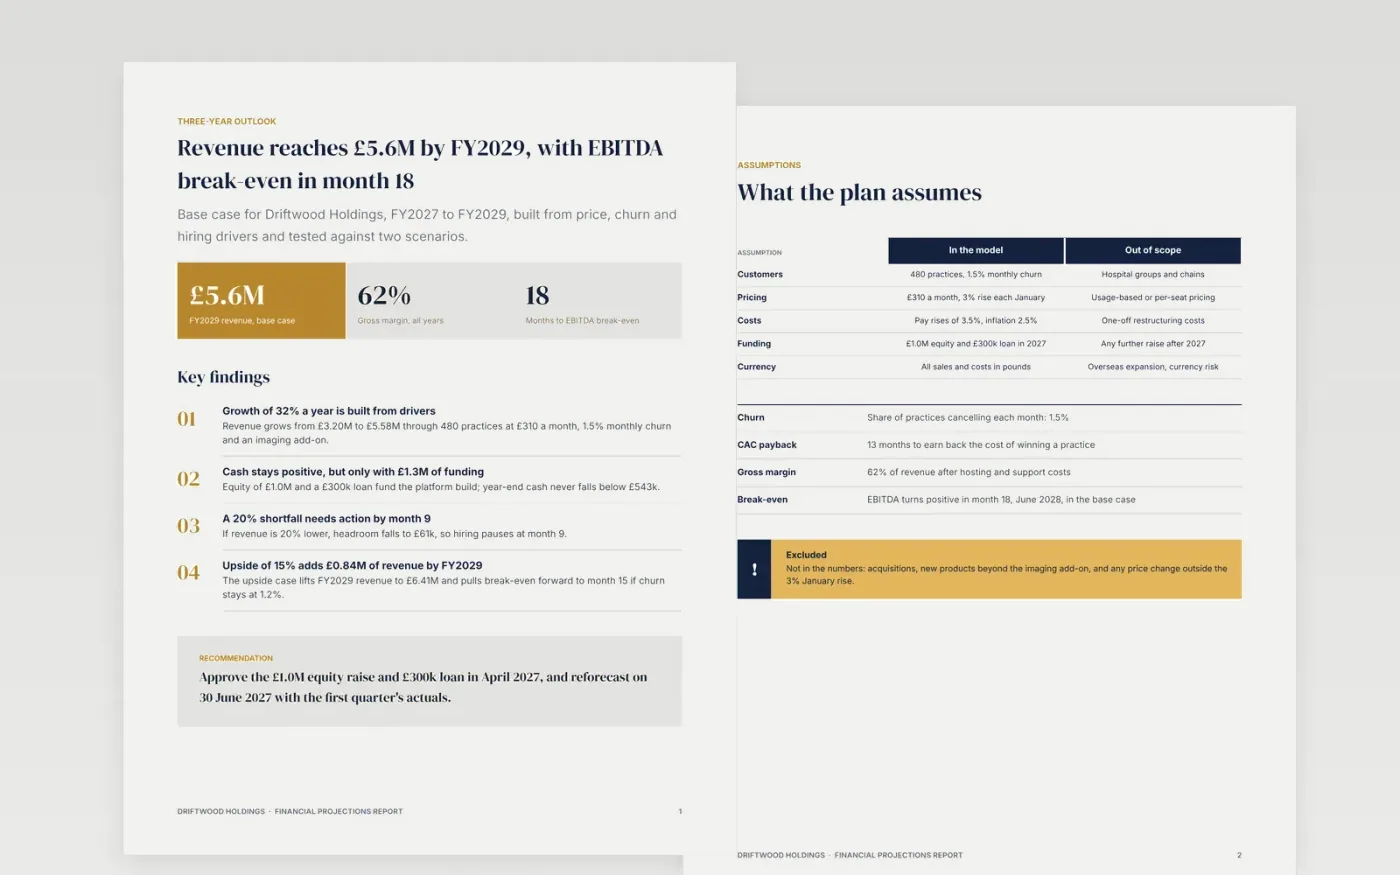
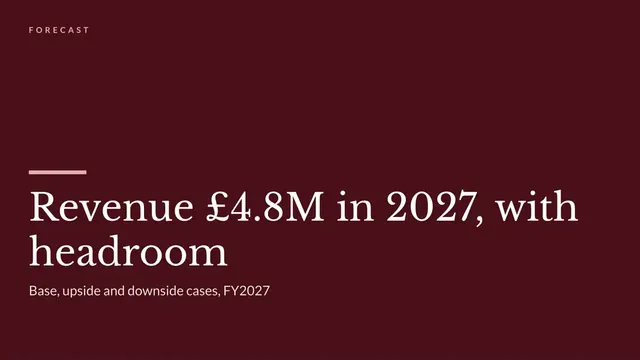
Investors and lenders judge a forecast by its assumptions and its downside, not by the headline growth rate. This template starts with the answer, then sets out what is in and out of scope, the revenue forecast, a variance view of costs, a cash flow statement that ties to the totals, and three scenarios with a recommendation.
The sample is a base case for Driftwood Holdings: revenue rising from £3.20M to £5.58M over FY2027 to FY2029, 62% gross margin, EBITDA break-even in month 18 and £92k of minimum cash headroom. Replace the drivers with your own, rebuild the tables from them, and set the upside and downside from what has moved in your market.
Click Make a copy in Google Docs, then confirm on the Google page. The copy is saved to your own Google Drive.
Replace the assumptions with your own price, volume, churn, wage and inflation inputs, and write the reasoning beside each.
Rebuild the revenue, cost and cash flow tables from those drivers so that every total ties to the cash flow.
Set the upside and downside percentages from what has moved in your market, enter your real opening cash and facility limits, and name an owner and reforecast date.
Delete the Make it yours page and share the report or present it to your investors or lender.
Yes. The sample shows downside, base and upside cases, plus a combined shock where sales fall and wages rise together, with revenue, break-even month and cash headroom for each.
The sample cash flow is built so every subtotal adds up to closing cash. When you rebuild it, include working capital and funding so profit and cash reconcile.
No. Driftwood Holdings, its customers and every figure are fictional and exist only to show what a finished set of financial projections looks like.
Slides + PowerPoint11 slides
Free
Docs + Word6 pages
Free
Docs + Word17 pages
Free
Sheets + Excel4 slides
Free
Docs + Word7 pages
Free
Docs + Word7 pages
Free
Docs + Word8 pages
Free