Three-Year Forecast for Small Businesses
Docs + Word8 pages
Free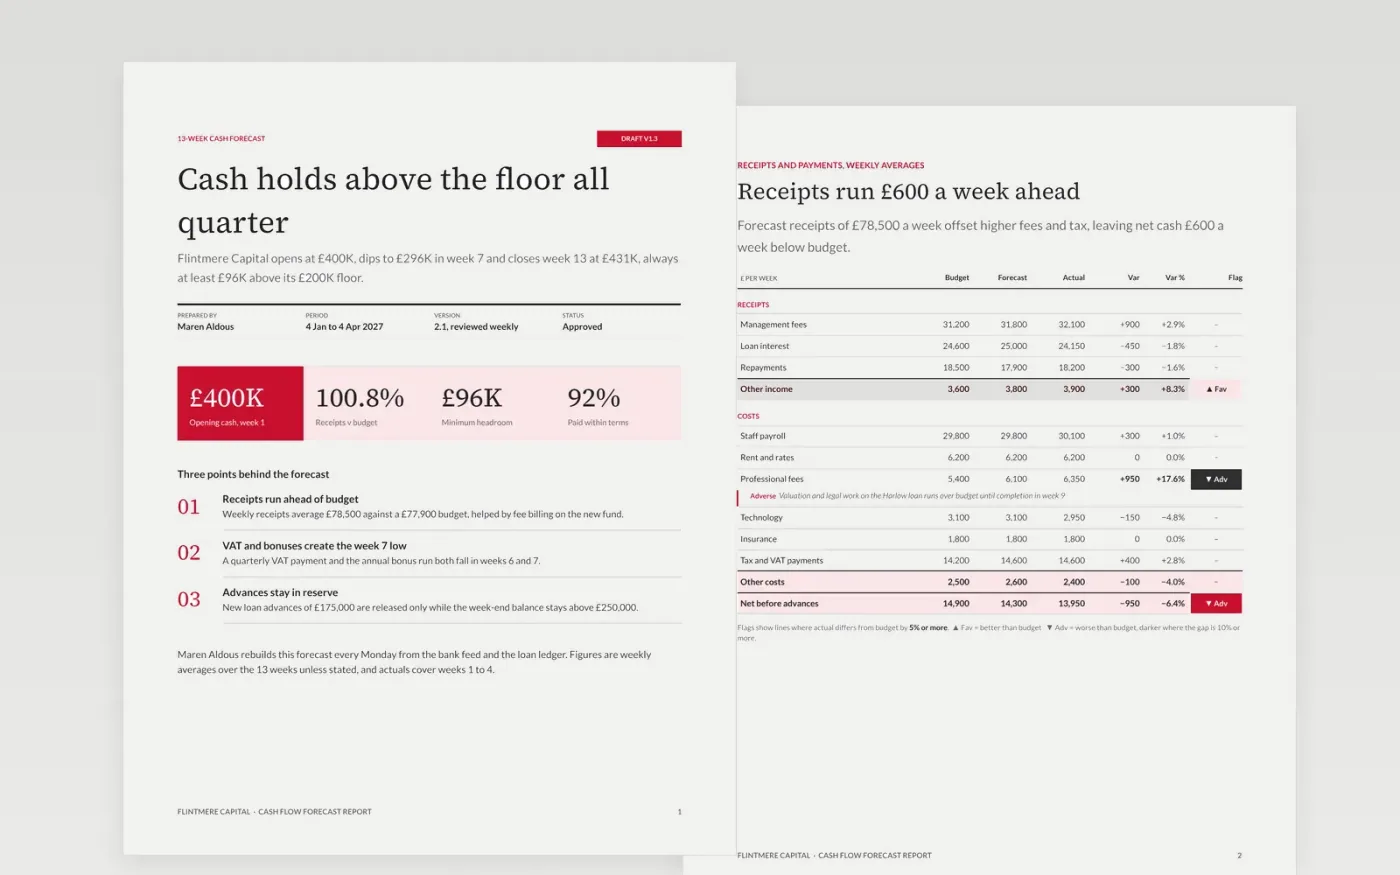
Finance managers often send a spreadsheet of weekly balances with no explanation, and lenders are left to work out where the pressure falls. This report puts the commentary beside the numbers: opening cash, receipts against budget, committed and flexible payments, headroom over the board floor, and a ranked register of what could move the forecast.
The sample follows Flintmere Capital through weeks 1 to 13 of 2027: cash opens at £400K, dips to £296K in week 7 after VAT and bonuses, and closes at £431K, always at least £96K above its £200K floor. Replace the opening balance, the receipts and payment lines, the floor and the risk owners with your own figures.
Click Make a copy in Google Docs, then confirm on the Google page. The copy is saved to your own Google Drive.
Enter your opening cash, the minimum cash floor and the forecast dates in the title block and headline figures on page 1.
Replace the receipts and payments lines with your own weekly averages, and keep the totals, the donut shares and the key figures table tied.
Re-rate the risks on both risk pages, name an owner for each and set a date for the next reforecast.
Delete the Make it yours guide page, then share the forecast with your lender or board or present it.
No. Flintmere Capital, its people and every figure are fictional sample data, written so that the totals tie. Replace them with your own before you share the document.
Weekly averages over the 13 weeks keep the table readable on one page. Link each line to your own model and show budget, forecast and actual on the same basis.
Yes. Edit the floor in the headroom text and key figures table, then update the chart values in Google Docs so the lowest balance and headroom still agree.
Docs + Word8 pages
Free
Docs + Word7 pages
Free
Docs + Word8 pages
Free
Sheets + Excel4 slides
Free
Slides + PowerPoint11 slides
Free