Three-Year Forecast for Small Businesses
Docs + Word8 pages
Free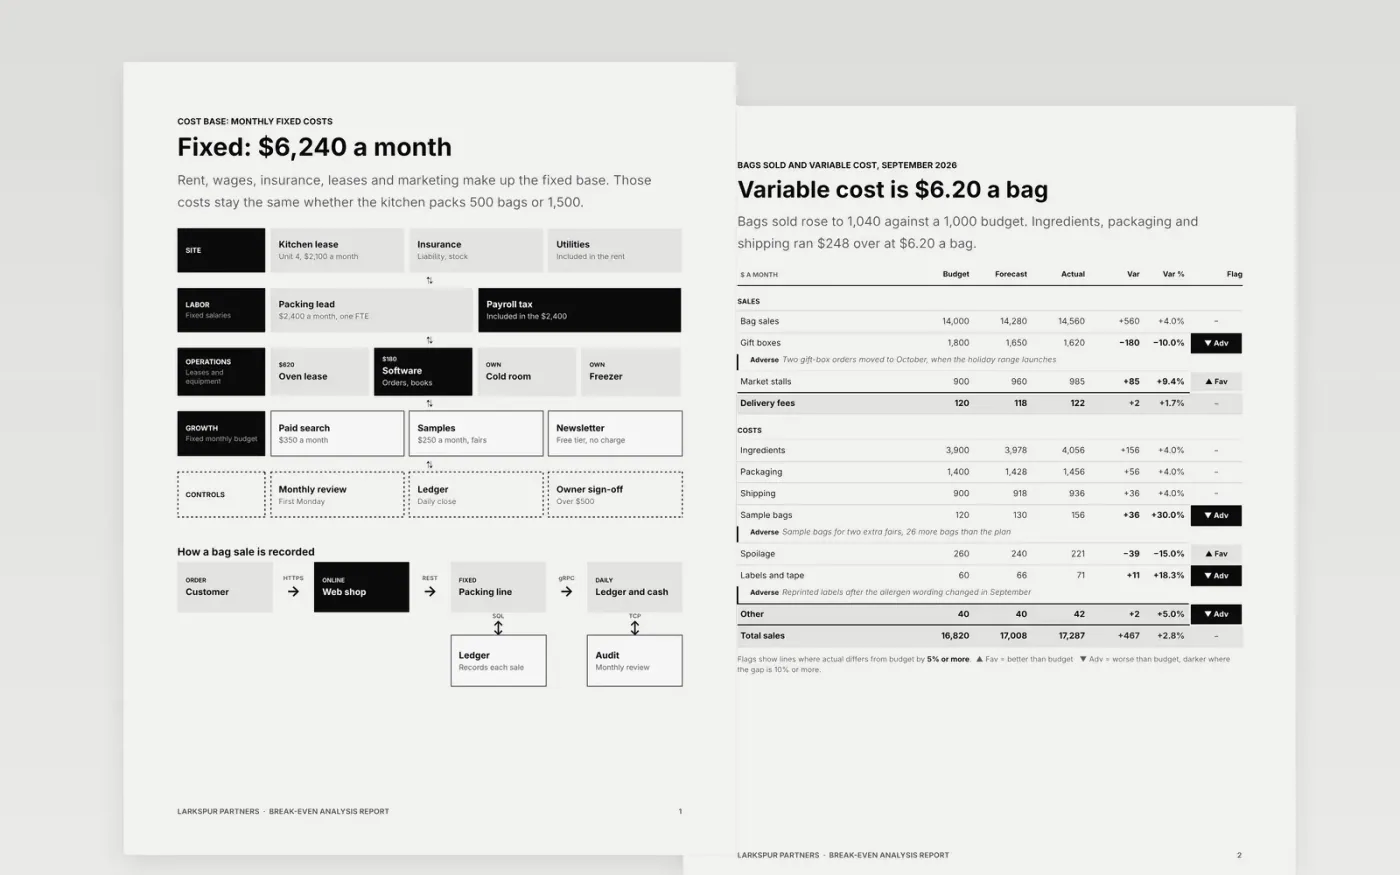
This template helps small business owners find the sales volume at which income covers every cost. It starts with fixed costs, then the variable cost per unit, the contribution each sale leaves, the break-even point in units and dollars, the margin of safety above it, and a sensitivity page that tests volume and cost shocks together. Each page builds on the one before, so every figure ties back to one set of inputs.
The sample follows Larkspur Partners, a fictional small-batch granola maker that sells 12-ounce bags at $14.00 each. Its monthly fixed costs of $6,240 and variable cost of $6.20 a bag give a break-even volume of 800 bags. Replace the inputs on the first two pages with your own rent, wages, unit price and ingredient costs, then rebuild the tables so the totals still tie out.
Click Make a copy in Google Docs, then confirm on the Google page. The copy is saved to your own Google Drive.
Replace the Larkspur sample inputs on pages 1 and 2 with your own rent, wages, unit price and variable costs.
Rebuild the break-even table and chart from those inputs, and check that the totals still tie to fixed costs.
Set the upside and downside cases from what has moved in your own market, then name an owner and a reforecast date.
Delete the guide page, then share the file or present it.
Yes. Make a copy in Google Docs and it is yours to edit. There is no sign-up on this page and no charge for the template.
Yes. Every table, chart and text box uses standard Google Docs styles, so you can change figures, rows and fonts as you would in any document.
No. Larkspur Partners, its people and every figure in this sample are fictional. Replace them with your own inputs before you share the document with anyone.
Docs + Word8 pages
Free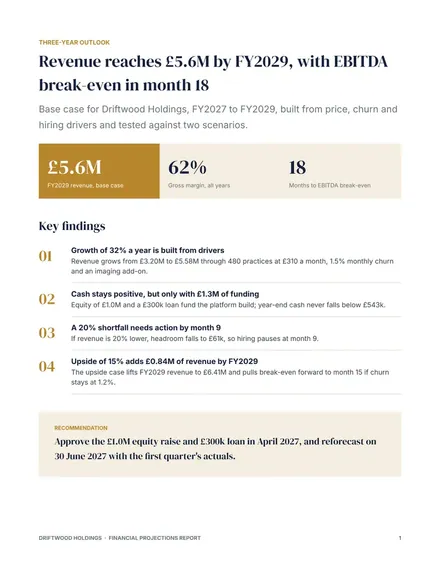
Docs + Word8 pages
Free
Docs + Word6 pages
Free
Sheets + Excel4 slides
Free
Docs + Word7 pages
Free
Slides + PowerPoint11 slides
Free