Financial Projections Report
Docs + Word8 pages
Free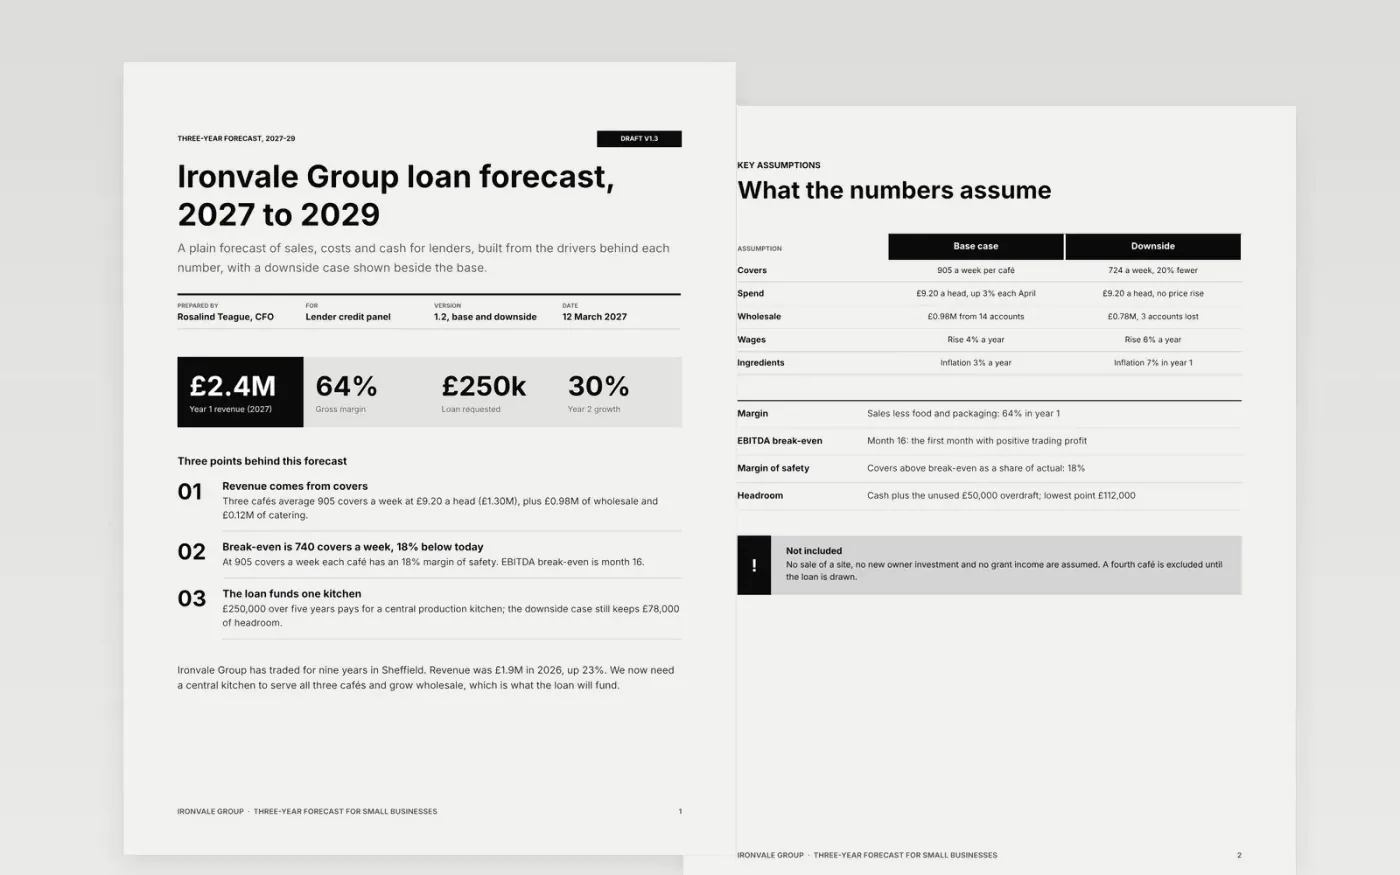
Lenders and grant panels do not want a hopeful percentage on last year's sales. They want to see what drives revenue, where costs sit, when cash is tightest and what happens if sales fall. This template sets out a plain three-year forecast in that order, starting with the business today and ending with notes on terms and reforecasting.
The sample follows Ironvale Group, a café and wholesale bakery business asking for a £250,000 loan for a central kitchen. It builds sales from covers and spend, shows a monthly cost variance, a three-year cash flow that ties to its totals, and a downside case with 20% less sales. Replace the drivers, tables and notes with your own, keeping the totals tied to cash.
Click Make a copy in Google Docs, then confirm on the Google page. The copy is saved to your own Google Drive.
Replace the assumptions with your own price, volume, wage and inflation inputs, and set the downside percentage from what has moved in your market.
Rebuild the sales, cost and cash tables from those drivers, and check that every total ties to the cash flow.
Enter your real opening cash and overdraft or facility limits in the headroom rows, and add the date of your next reforecast.
Delete the Make it yours guide page, then share the forecast with your lender or present it.
Lenders judge whether a plan is believable by how it behaves under stress. Showing sales 20% lower, with the cash headroom that remains, builds more trust than a single optimistic case.
No. Ironvale Group, its people and every figure are fictional sample data. Replace the drivers and tables with your own before you send anything to a lender.
The cash flow page is built from the same sales and cost drivers, so receipts, payments, the loan and closing cash add up. Keep that link when you replace the figures.
Docs + Word8 pages
Free
Slides + PowerPoint11 slides
Free
Docs + Word6 pages
Free
Sheets + Excel4 slides
Free
Docs + Word7 pages
Free
Docs + Word7 pages
Free