Social Impact Report
Docs + Word8 pages
Free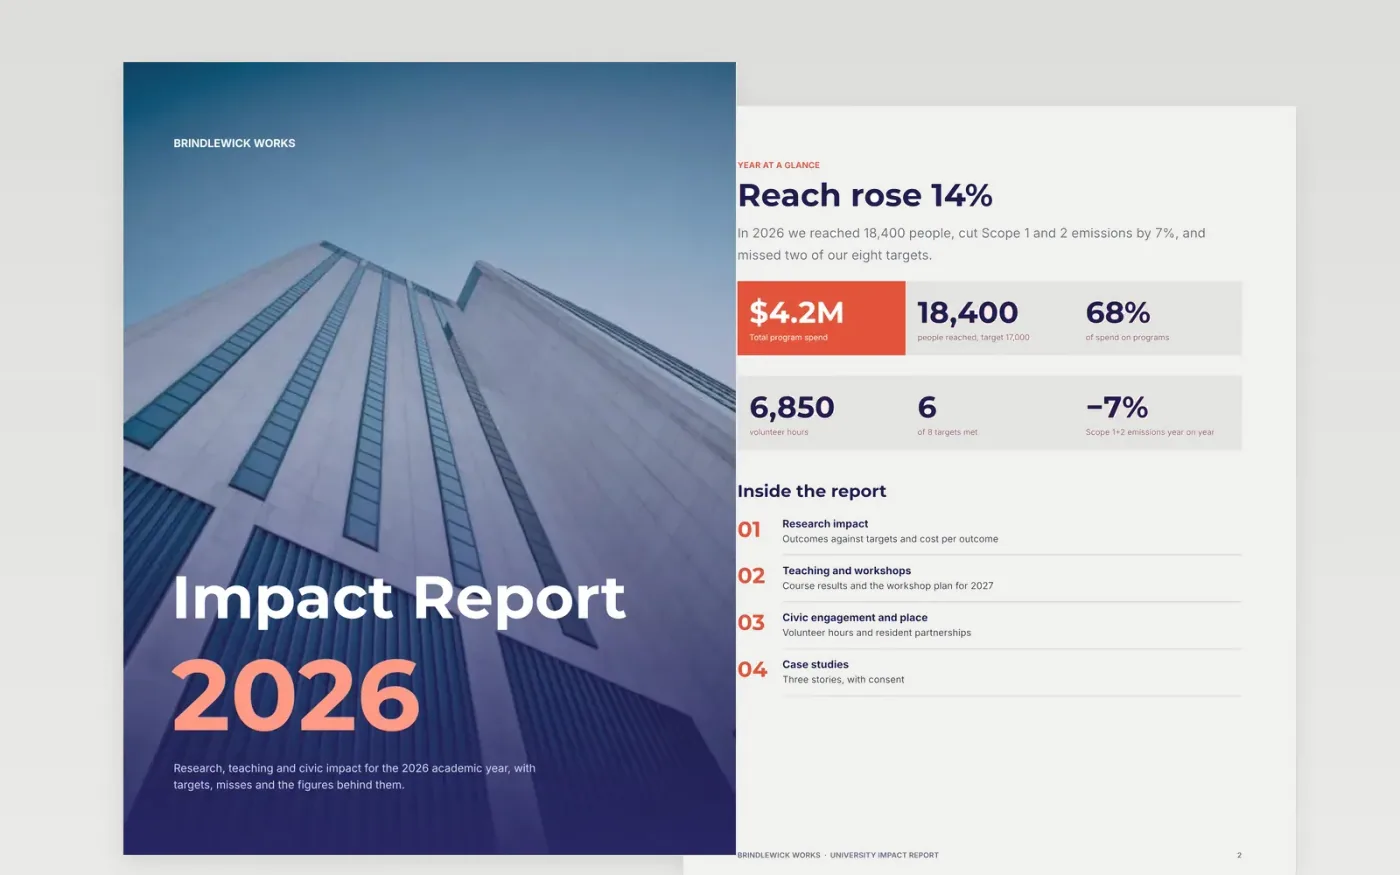
This template gives a research body or university one document for reporting the year's impact, read by funders, staff and residents alike. It opens with a year-at-a-glance page, then covers research impact, teaching, civic engagement and case studies. Each section puts a number beside the target it was measured against, so misses sit next to the wins. The order follows how readers actually scan: plain figures first, then the stories that explain them.
The sample describes Brindlewick Works, and its people and figures are invented, including 18,400 people reached and six of eight targets met. To adapt it, replace the headline figures on page 2, rebuild the chain from inputs to outcomes in your own words, and swap in two real case studies once you have written consent. Trace every number to audited accounts or a data log, and state the base year for any emissions figure before you publish.
Click Make a copy in Google Docs, then confirm on the Google page. The copy is saved to your own Google Drive.
Replace the headline figures on page 2 and the chart values on page 3 with your audited numbers.
Rewrite both case studies, then get written consent before naming anyone or using a photo.
Check that every target, percentage and donut slice matches your source data before you share it.
Delete the Make it yours guide page, then share the document or present it to your board.
No. Brindlewick Works, its staff and every figure in this template are fictional sample data, written so you can see what good looks like.
Yes. The structure suits universities, research institutes, nonprofits and public bodies that report outcomes to funders each year. Swap in your own programs and measures.
List every target in the key figures table, mark the ones you missed, and say what you will change next year. Funders and trustees trust reports that show misses.
More Google Docs templatesMore business operations templates
Docs + Word8 pages
Free
Docs + Word8 pages
Free
Docs + Word8 pages
Free
Slides + PowerPoint12 slides
Free
Docs + Word7 pages
Free
Slides + PowerPoint10 slides
Free
Slides + PowerPoint12 slides
Free
Docs + Word8 pages
Free
Slides + PowerPoint10 slides
Free