Carbon Footprint Report
Docs + Word8 pages
Free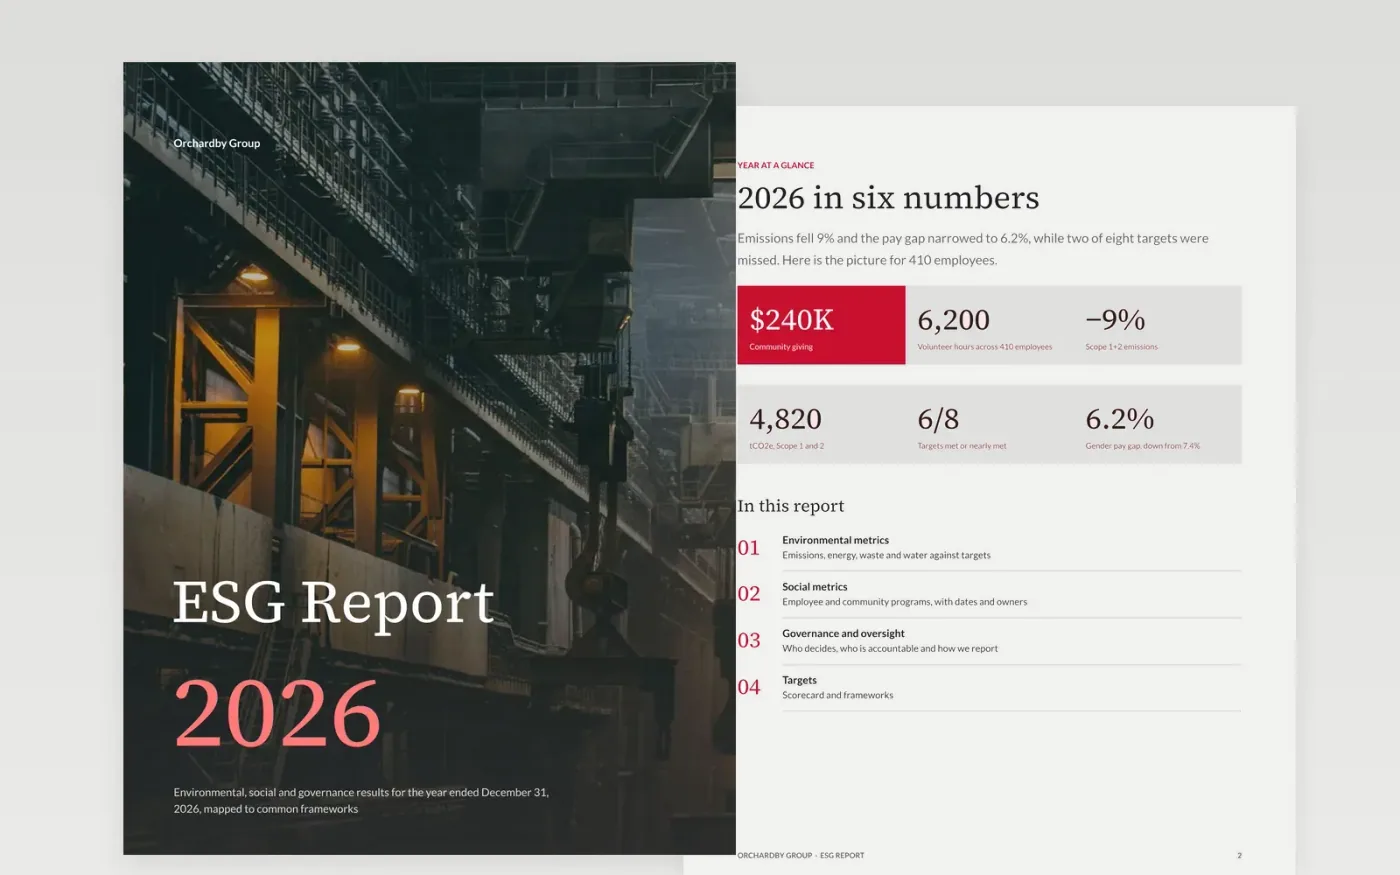
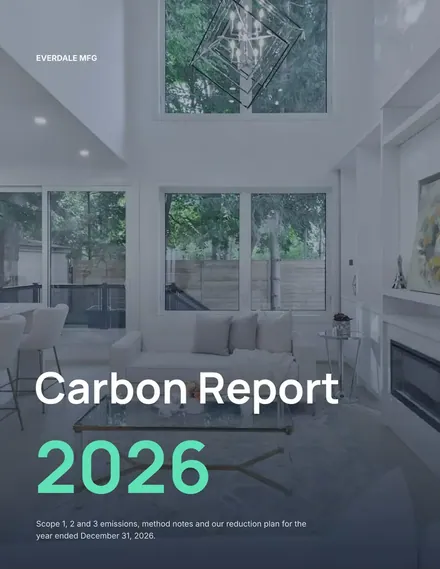
Investors, procurement teams and staff want ESG numbers they can check, not a gallery of good intentions. This report gives them a year at a glance, the basis for the emissions figures, a plan for people and community engagement, a clear map of who is accountable, a target scorecard and an index linking each metric to common standards.
The sample follows Orchardby Group in 2026: Scope 1 and 2 emissions of 4,820 tCO2e, down 9%, a gender pay gap of 6.2%, 6,200 volunteer hours and two of eight targets missed. Replace the figures, boundaries, owners, targets and framework mapping with your own, and report your misses next to your wins.
Click Make a copy in Google Docs, then confirm on the Google page. The copy is saved to your own Google Drive.
Replace the six headline figures and the reporting year with your own results and prior-year comparison.
Rewrite the emissions boundary, base year and factor sources, and state each metric on the same basis as last year.
Update the scorecard with your own targets and mark every miss, then name an owner for each metric and framework mapping.
Delete the Make it yours guide page, then share the report with investors, customers and staff or present it.
No. Orchardby Group, its people, emissions and every figure are fictional sample content. Replace them with your own audited or reviewed data before you publish.
Readers trust a report more when misses are shown next to wins. The sample misses two of eight targets and gives the reason and an owner for each.
The index uses generic standard names so you can replace them with the frameworks your investors and customers ask for. Keep the page references accurate.
More Google Docs templatesMore business operations templates
Docs + Word8 pages
Free
Docs + Word8 pages
Free
Docs + Word7 pages
Free