Board Meeting Deck
Slides + PowerPoint20 slides
Free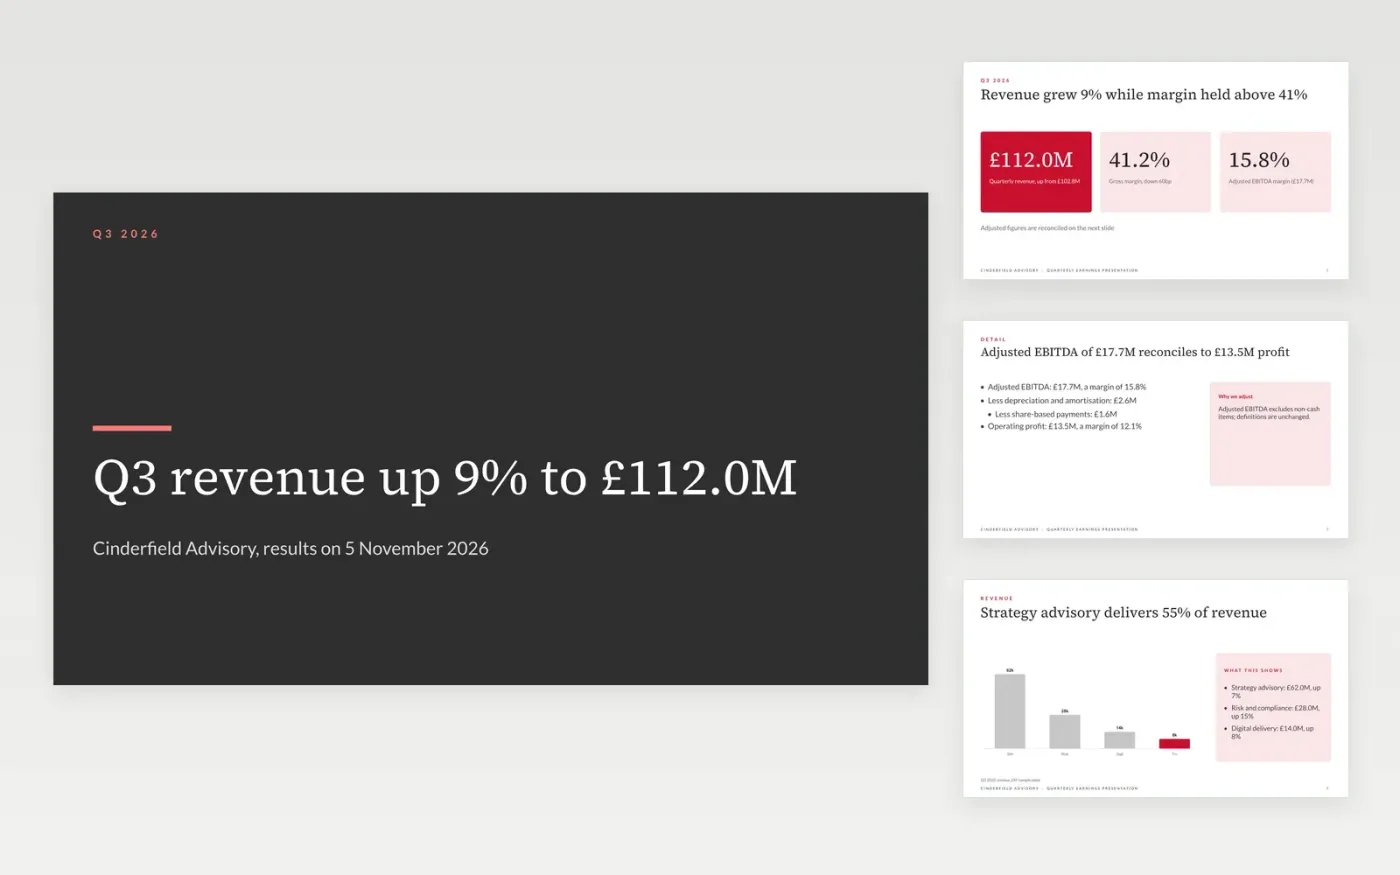
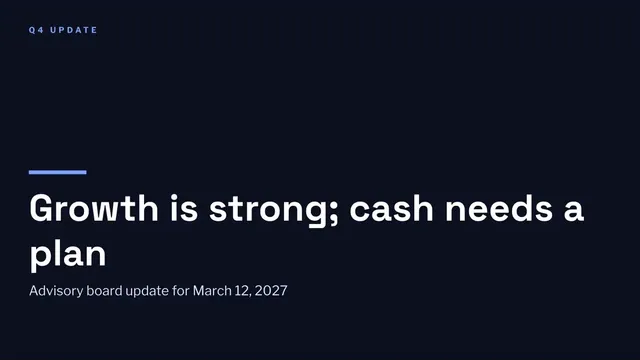
Analysts and investors expect results in a familiar order, with every adjusted measure tied back to a statutory one. This earnings deck follows that order: headline numbers, a reconciliation, revenue by segment, cash flow and net debt, guidance with assumptions, and a slide for the questions you expect. It runs to eleven slides.
The sample is a third-quarter update from Cinderfield Advisory, with revenue of £112.0 million, up 9% on last year, a gross margin of 41.2% and full-year guidance of £455 million to £465 million. Replace the figures, segments and assumptions with your own, and add your cautionary statement before you present.
Click Make a copy in Google Slides, then confirm on the Google page. The copy is saved to your own Google Drive.
Replace the headline numbers with your quarter's revenue, margin, adjusted EBITDA and cash flow, and enter the reconciliation to statutory profit.
Rebuild the segment chart and cards with your own categories, and explain the cause of any decline.
Rewrite the guidance with your range and the three assumptions behind it, then add your cautionary statement.
Delete the Make it yours slide, then present the deck or share it.
Quarter highlights, a financial summary against last year and guidance, segment results, cash flow and net debt, strategic progress, an outlook with assumptions and a questions slide.
Always reconcile adjusted EBITDA to operating profit, keep definitions the same from quarter to quarter and say why each item is excluded, as the third slide does.
No. Cinderfield Advisory, its people and every figure are fictional sample content. Replace all of it with your own reported results before presenting.
Slides + PowerPoint20 slides
Free
Docs + Word17 pages
Free
Excel
Free
Docs + Word6 pages
Free
Docs + Word7 pages
Free