Monthly Business Review Deck
Slides + PowerPoint10 slides
Free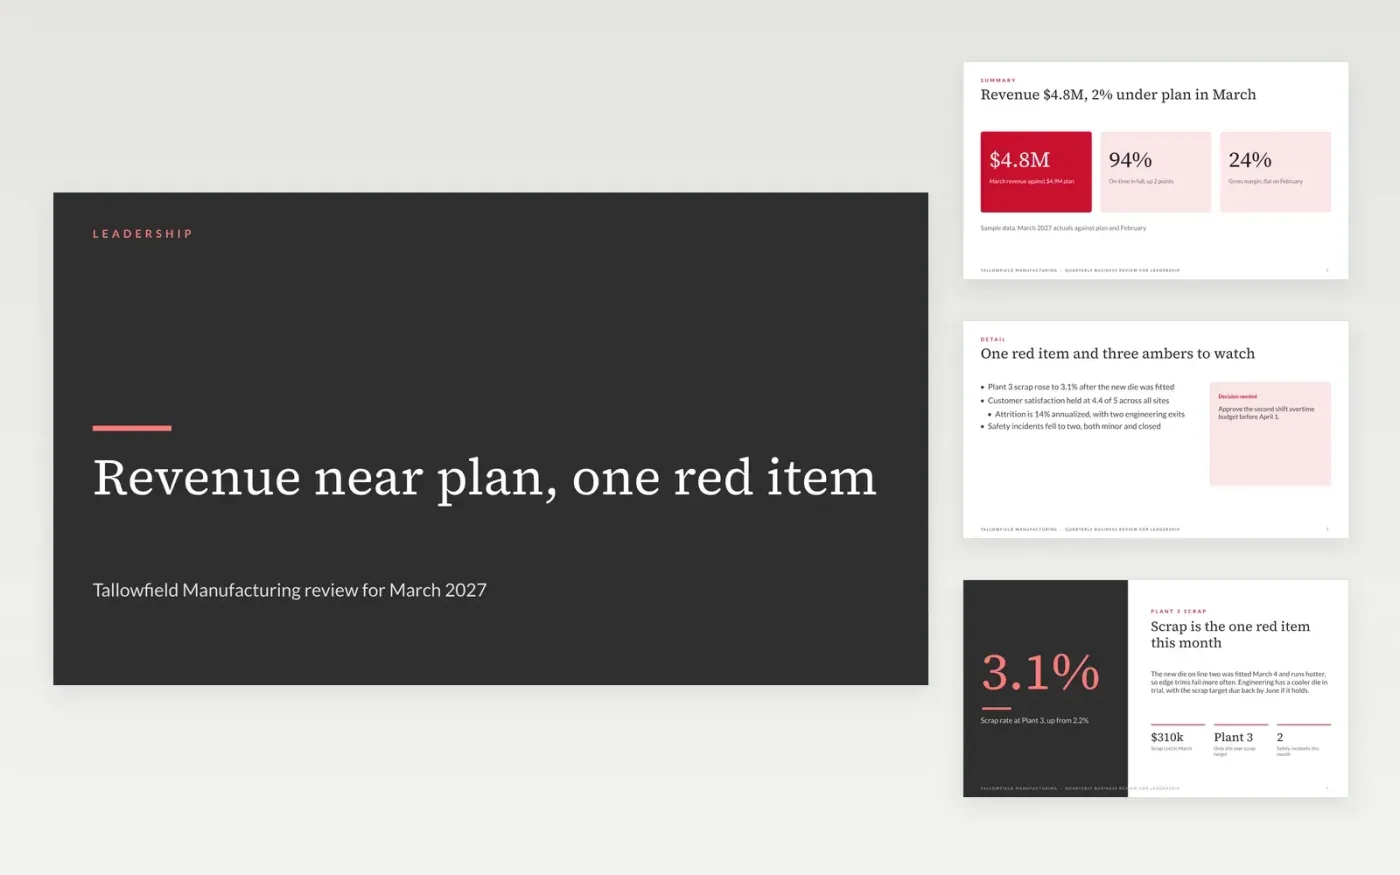
Operations and finance leads use this deck to show leadership whether the business is on plan across revenue, operations, customers and people in one sitting. It leads with the headline numbers, then the function scorecards, the risks with their owners and the priorities for the next period. The layout keeps each red or amber item to one explained sentence, so the discussion stays on the few things that need a decision.
The sample is for Tallowfield Manufacturing, a fictional maker of industrial fittings, and every figure, name and date is sample data. It shows March revenue of $4.8M against a $4.9M plan, on-time in full at 94% and a single red item on scrap. Replace the period and the headline figures with last month's actuals, keep at most three metrics for each function, and sort your league table on one agreed measure.
Click Make a copy in Google Slides, then confirm on the Google page. The copy is saved to your own Google Drive.
Set the period, then replace the headline figures with last month's actuals against plan.
Keep at most three metrics per function, and write the definition and source beneath each one.
Write one sentence of cause and one of action beside every red or amber status, with an owner and a date.
Delete the guide slide, then share the deck with the leadership team or present it from Google Slides at the meeting.
No. Tallowfield Manufacturing, its leadership team and every figure in this deck are fictional sample data, included so you can see a finished review before writing your own.
No more than three. Pick the measures that move the business, state each definition and source, and move everything else to the function's own pack so the three that matter are not lost.
Name the cause in one sentence, the action in a second, and an owner with a date. A red status with no action is a report, not a decision, and leadership should send it back.
More Google Slides templatesMore business operations templates
Slides + PowerPoint10 slides
Free
Slides + PowerPoint10 slides
Free
Slides + PowerPoint11 slides
Free
Slides + PowerPoint12 slides
Free
Docs + Word8 pages
Free
Slides + PowerPoint10 slides
Free
Slides + PowerPoint12 slides
Free
Docs + Word7 pages
Free