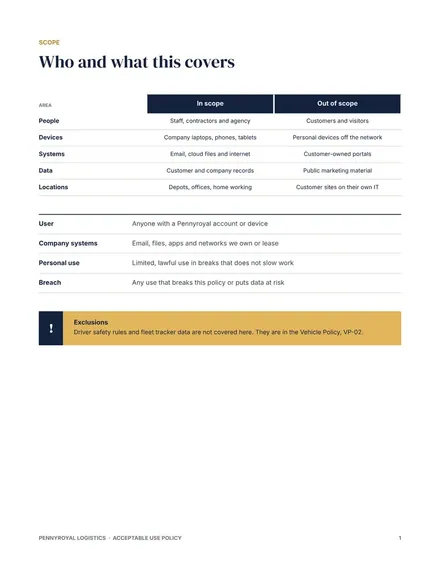
Acceptable Use Policy
Docs + Word7 pages
Free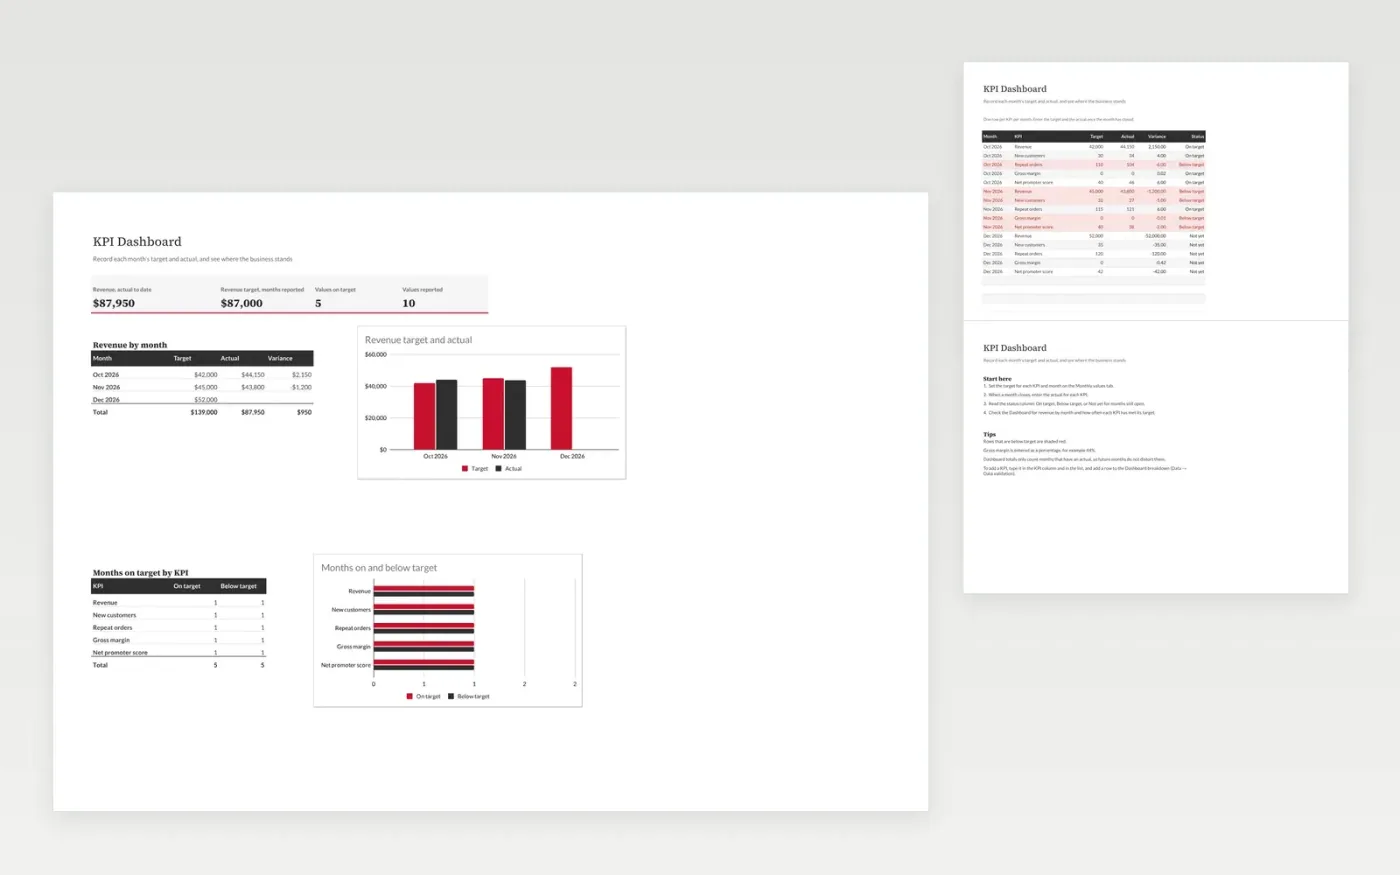
The KPI Dashboard tracks a small set of business measures each month. The Monthly values tab holds the target and the actual for each KPI, with the variance and a status that reads On target, Below target or Not yet. The Dashboard totals revenue for months that have been reported and counts how often each KPI has met its target.
It comes with sample data for October and November, with December left open for entry. Make a copy and replace the sample rows. The formulas, dropdowns and charts update on their own.
Click Make a copy in Google Sheets, then confirm on the Google page. The copy is saved to your own Google Drive.
Start on the Monthly values tab: replace the sample rows with your own.
Keep the formula columns as they are; they fill in as you type.
Read the How to use tab for tips. For Excel, download the .xlsx file instead.
Yes. Make a copy in Google Sheets or download the .xlsx file for Excel. There is no charge for the template.
Yes. Download the .xlsx file and open it in Excel. The formulas, dropdowns and charts work there as well as in Google Sheets.
A month shows Not yet when its actual is still blank. Once you enter the actual, the status changes to On target or Below target, and the dashboard totals include it.
More Google Sheets templatesMore business operations templates
Docs + Word7 pages
Free
Docs + Word8 pages
Free
n8n
Free