New Hire Orientation Deck
Slides + PowerPoint16 slides
Free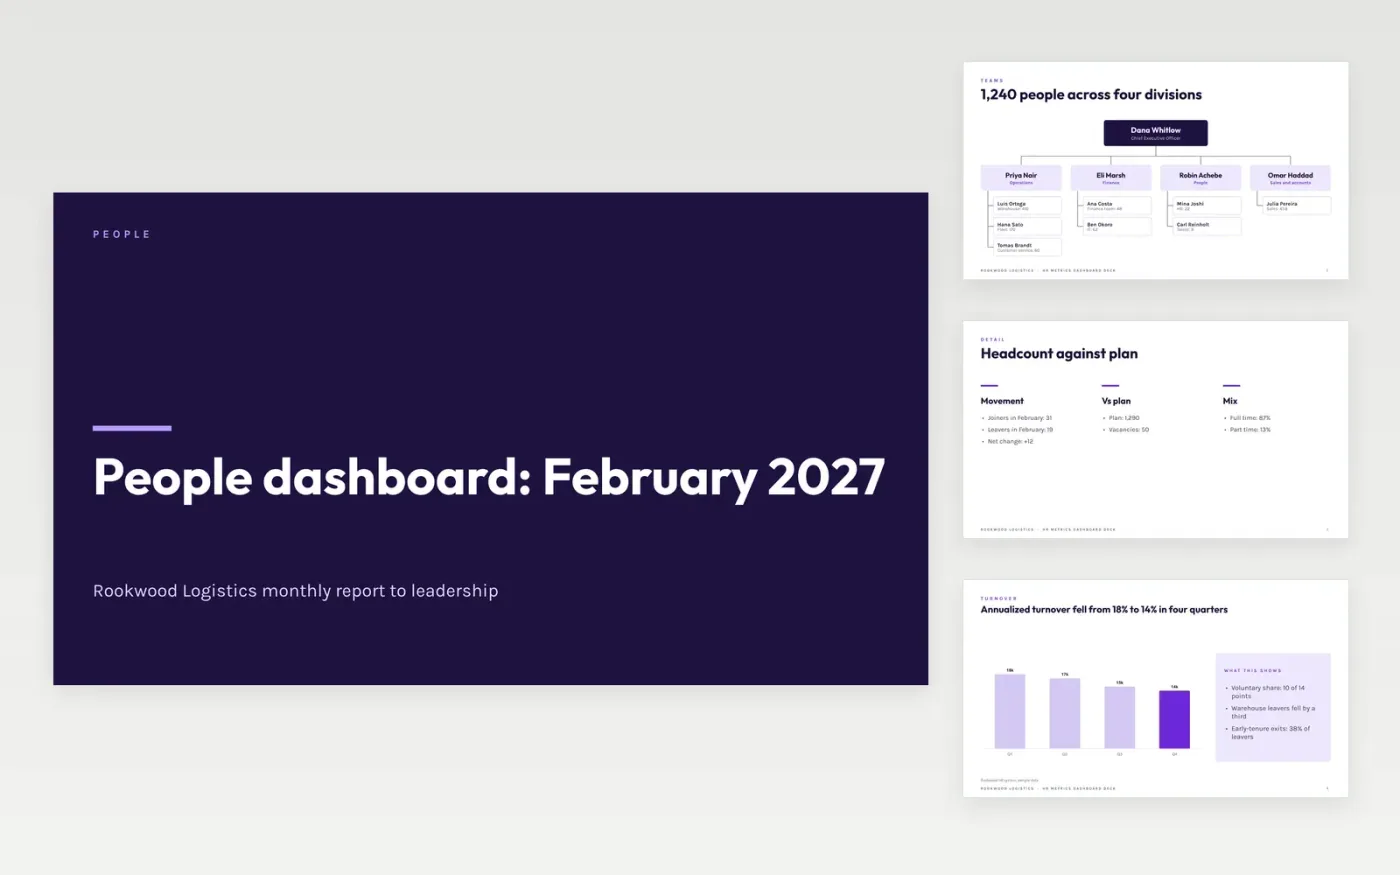
Leaders want a regular, trusted view of workforce health, not 30 numbers with no comment. This deck gives HR a monthly structure: where headcount sits against plan, what turnover costs, why absence is moving, how hiring is performing, a six-row scorecard and the actions that follow.
The sample follows Rookwood Logistics, a fictional carrier with 1,240 employees in February 2027. It shows 14% annualized turnover costing $1.6M, a 3.6% absence rate, 41 days to hire and one metric off track. Replace the figures with last month's HR system data, set your own definitions and end with one ask.
Click Make a copy in Google Slides, then confirm on the Google page. The copy is saved to your own Google Drive.
Replace the headline metrics with last month's figures from your HR system and write down how each is defined.
Update the turnover and absence charts with a 12-month trend, and set a target for each scorecard row.
Pick the three risks leaders should discuss, then write one decision or ask on the actions slide.
Delete the guide slide, then share the deck or present it.
No. Rookwood Logistics, its people and every figure in the deck are fictional sample data. Replace them with your own before sharing.
Write the definition on the slide. The sample uses leavers over the last 12 months divided by average headcount, shown as an annualized rate.
Be careful. Groups of fewer than ten people can identify individuals, so combine them or follow your data-protection and anonymity thresholds.
Slides + PowerPoint16 slides
Free
Docs + Word7 pages
Free
Docs + Word21 pages
Free
Docs + Word7 pages
Free
Docs + Word8 pages
Free