Board Meeting Deck
Slides + PowerPoint20 slides
Free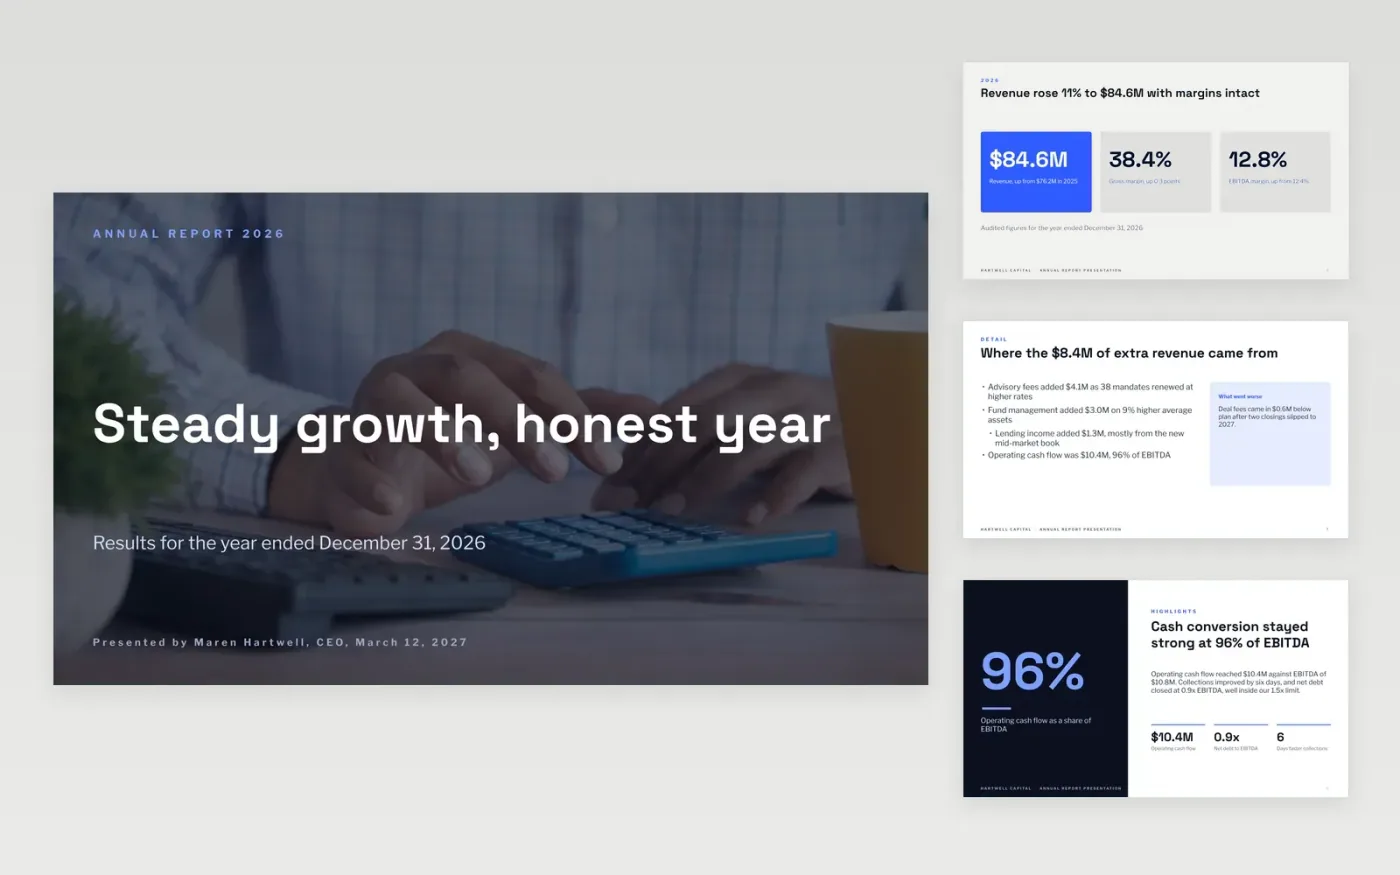
An annual report read aloud tends to bury its figures. This deck turns the year into eleven slides, each built around one number: headline results, a highlight, a revenue chart, client health, the team and a short list of dated commitments, so an AGM or an all-hands can follow the story without a spreadsheet.
The sample follows Hartwell Capital, a fictional finance firm, through a year of 11% revenue growth. Revenue, margin, cash and dividend cover agree on every slide, and one slide names what went worse than planned. Replace the figures with your audited results, then rewrite the commitments with a measure and a date each.
Click Make a copy in Google Slides, then confirm on the Google page. The copy is saved to your own Google Drive.
Replace the headline figures on the two number slides with your audited revenue, margin, profit, cash and dividend.
Edit the revenue chart data to your own quarters or last five years, and update the insight lines to match.
Rewrite the client, people and timeline slides, giving each commitment a measure and a date you can be held to.
Delete the guide slide at the end, then share the deck or present it.
Yes. Swap revenue for income, replace dividend cover with a reserves line, and use the highlight slide for the share of spending that reaches programs.
Click the chart, open the linked data in Google Sheets and edit the four values. The labels and the bars update when you refresh the chart in the deck.
No. Hartwell Capital, the people named and every figure are fictional sample data. Replace them with your own audited results before you present.
Slides + PowerPoint20 slides
Free
Docs + Word17 pages
Free
Docs + Word6 pages
Free
Slides + PowerPoint11 slides
Free
Docs + Word8 pages
Free
Docs + Word8 pages
Free
Docs + Word8 pages
Free
Docs + Word7 pages
Free