Bank Quarterly Results Deck
Slides + PowerPoint10 slides
Free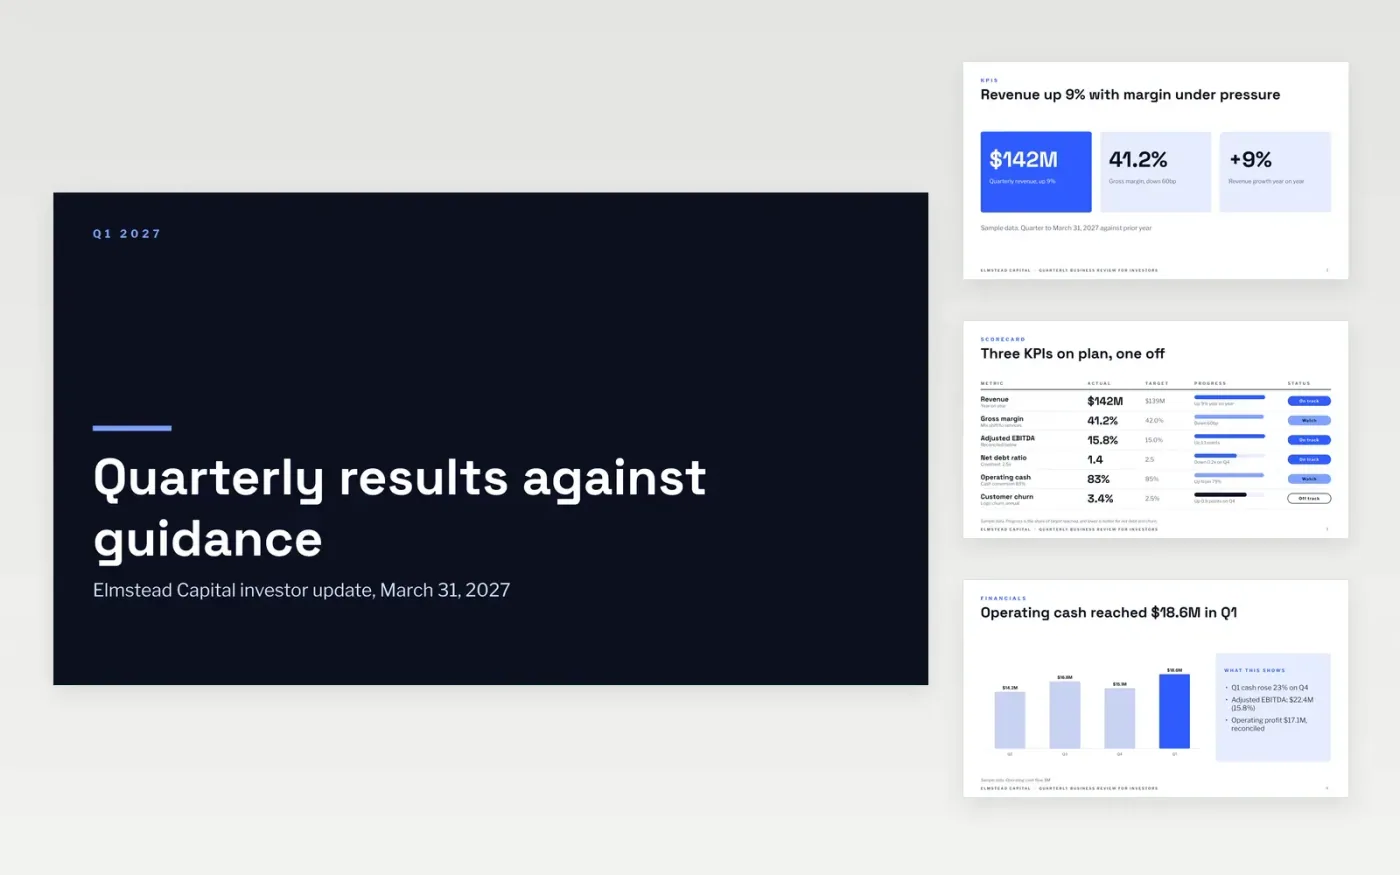
Finance teams at private companies use this deck to explain a quarter's results to institutional investors in a standard order. It opens with the KPIs, moves through the financials and the profit bridge, then covers strategy progress, risks and the outlook. Each slide states its point in the title, so the deck can be read in about fifteen minutes before a call with analysts or lenders.
The sample is for Elmstead Capital, a fictional private company, and every figure and name is sample data. It shows revenue of $142M, up 9%, adjusted EBITDA of $22.4M reconciled to operating profit, and full-year guidance of $575M to $590M. Replace the headline numbers with your own quarter, rebuild the segment slide with your categories, and add your cautionary statement before the deck is shared.
Click Make a copy in Google Slides, then confirm on the Google page. The copy is saved to your own Google Drive.
Replace the headline numbers with your quarter's revenue, margin, adjusted EBITDA and cash flow against guidance.
Enter the reconciliation of adjusted measures to statutory profit on the bridge table, line by line.
Rewrite the guidance range and the three assumptions behind it, and name the cause of any segment decline.
Delete the guide slide, then add your cautionary statement and share the deck or present it from Google Slides.
No. Elmstead Capital, its executives and every figure in this deck are fictional sample data, so you can see how a complete investor deck reads before you add your own.
Yes, if you reconcile each one to the statutory figure on the same slide. Quoting an adjusted number without its bridge is one of the fastest ways to lose an analyst's trust.
Put it near the front, before any forward-looking figure, and repeat it on the outlook slide. Placing it at the end, or leaving it out, makes guidance look harder to trust.
Slides + PowerPoint10 slides
Free
Slides + PowerPoint11 slides
Free
Slides + PowerPoint11 slides
Free
Slides + PowerPoint10 slides
Free
Slides + PowerPoint12 slides
Free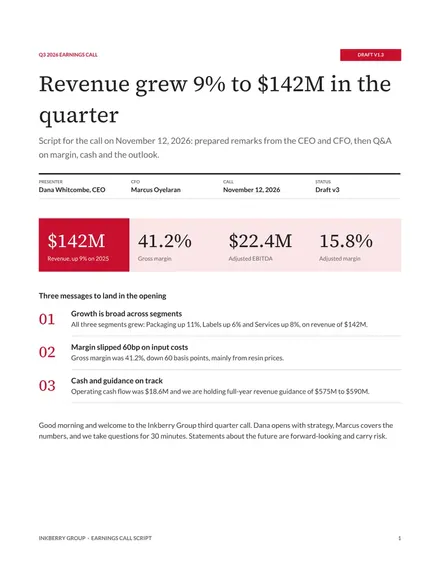
Docs + Word7 pages
Free
Docs + Word8 pages
Free