Project Proposal
Docs + Word5 pages
Free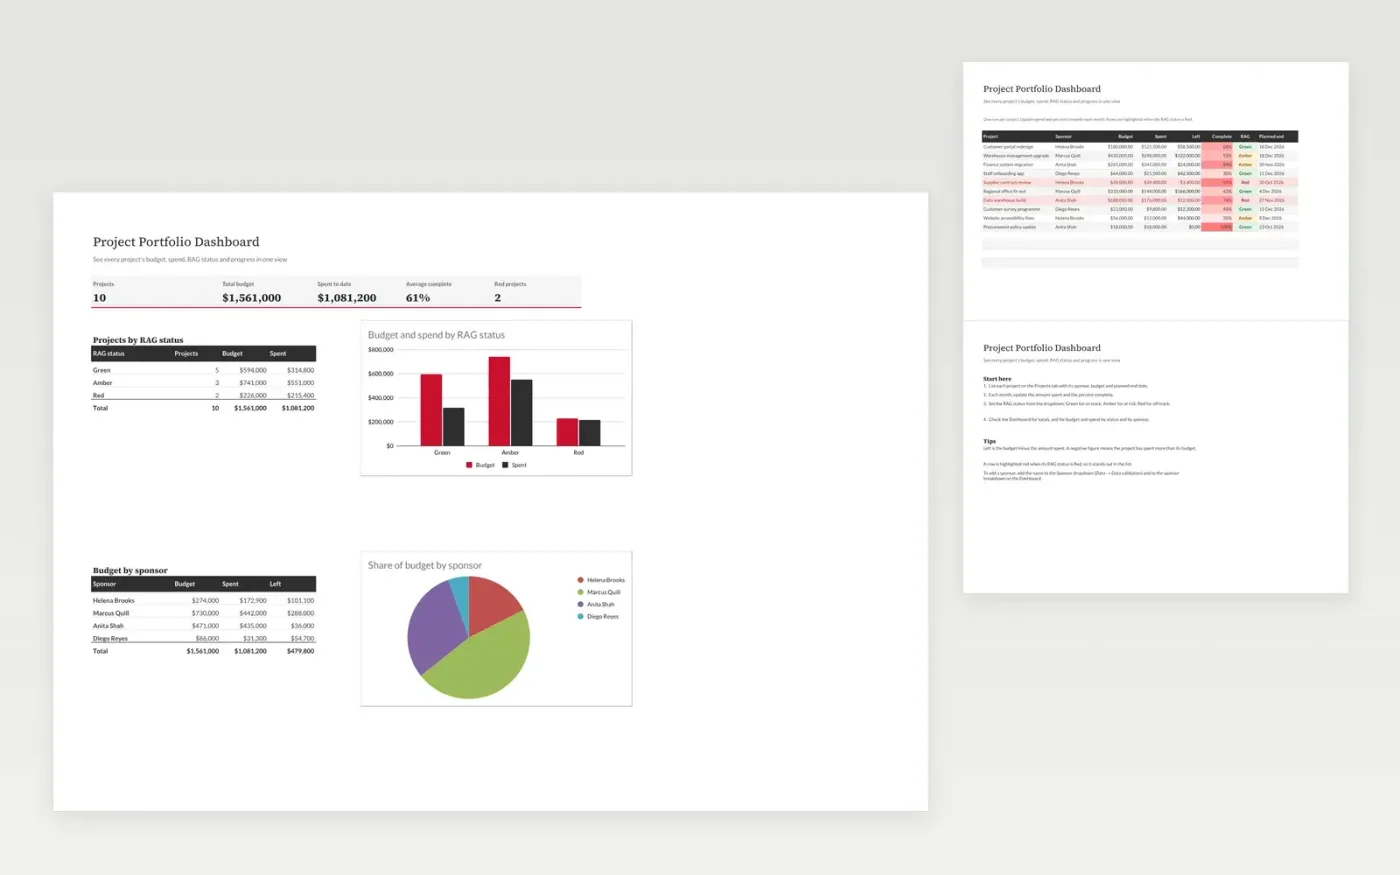
This portfolio dashboard lists every project with its sponsor, budget, spend, percent complete and RAG status. The Projects tab holds the register, and a row is highlighted when its project is Red. The Dashboard totals budget and spend by RAG status and by sponsor, and charts the results for a monthly review.
It comes with sample data for a small organisation's project portfolio. Make a copy, replace the sample rows with your own, and the left-over budget, totals and charts update on their own.
Click Make a copy in Google Sheets, then confirm on the Google page. The copy is saved to your own Google Drive.
Start on the Projects tab: replace the sample rows with your own.
Keep the formula columns as they are; they fill in as you type.
Read the How to use tab for tips. For Excel, download the .xlsx file instead.
Yes. The Project Portfolio Dashboard template is free to download and use. Make a copy in Google Sheets or download the Excel file.
Yes. Download the .xlsx file and open it in Excel, Google Sheets or another compatible spreadsheet app. The totals, highlights and charts work in both.
Left is the budget minus the amount spent. A negative figure means the project has spent more than its budget.
More Google Sheets templatesMore project management templates
Docs + Word5 pages
Free
Slides + PowerPoint11 slides
Free
Docs + Word6 pages
Free