Finance Director Update Slides
Slides + PowerPoint10 slides
Free
A monthly finance report fails when it repeats the ledger and leaves the CEO to work out what it means. This deck gives the finance director a set order for the month: headline numbers first, then a KPI scorecard against targets, the debtor days and margin detail, a cash conversion table and a notes page that states what changed in the forecast and what leadership must decide. Every metric carries a target, so 47 debtor days reads as above plan rather than as a bare number.
The sample is the February close for Orchardby Capital: revenue of $18.4M, EBITDA of $2.6M at a 14.1 percent margin, 91 percent cash conversion and debtor days at 47 against a 45-day target. Replace the month and figures with your own, put the one message the CEO must hear into the headline, and list each forecast assumption that changed. Keep the decisions note, since it turns the report into dated asks.
Click Make a copy in Google Slides, then confirm on the Google page. The copy is saved to your own Google Drive.
Set the month on the cover, then replace the headline with the one message the CEO must hear.
Update the scorecard actuals and targets, then write one-line causes for the largest variances.
Replace the forecast range and list the assumptions that changed since last month.
Delete the guide slide, then share the deck or present it to the leadership team.
No. Orchardby Capital, the people named in the deck and every figure are fictional sample data. Replace them with your own organization's numbers before anyone outside finance sees the report.
Yes. Use the cover, headline and notes slides for a treasurer's summary, and delete the scorecard and margin pages if your committee does not track them. Keep a source line on every figure.
Use the target your board has agreed, such as the 45 days in this sample. Show the target beside the actual, so readers can tell whether 47 days is good or poor without asking.
Slides + PowerPoint10 slides
Free
Slides + PowerPoint10 slides
Free
Slides + PowerPoint12 slides
Free
Docs + Word7 pages
Free
Slides + PowerPoint11 slides
Free
Docs + Word8 pages
Free
Docs + Word10 pages
Free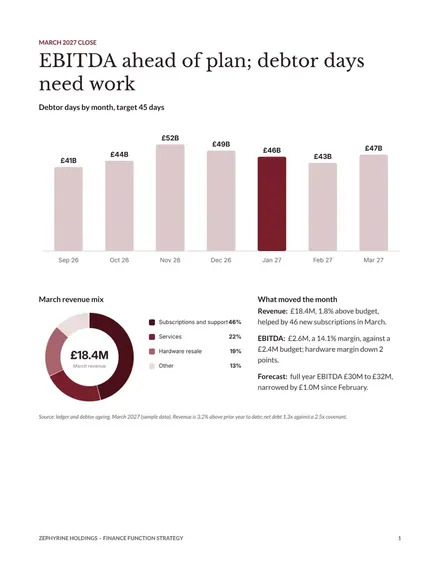
Docs + Word8 pages
Free