Business Case
Docs + Word8 pages
Free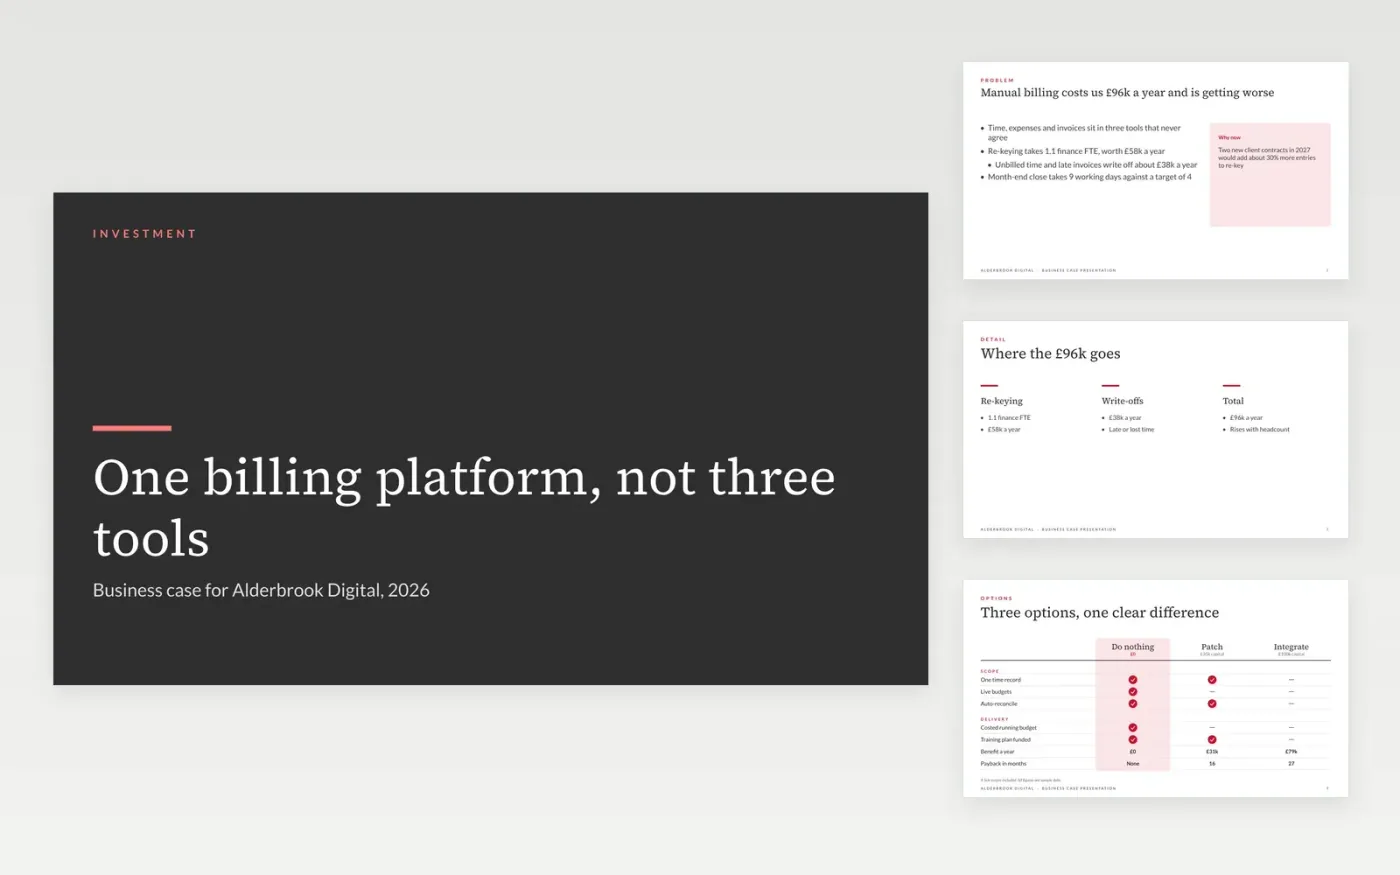
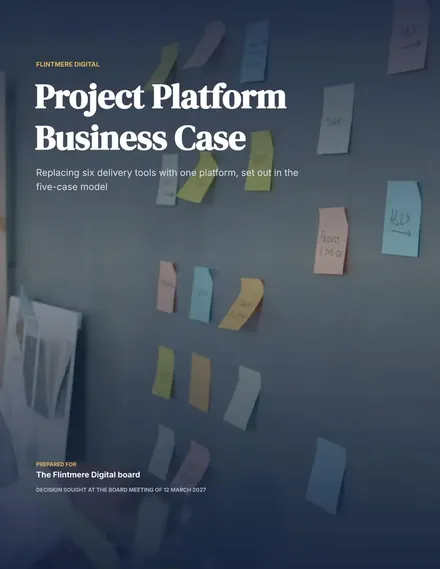
Sponsors lose investment cases when the options are straw men or the benefits have no basis. This deck opens with the cost of the problem, sets do nothing, a minimum fix and the recommended option side by side, then shows the return, a sensitivity check and the decision sought.
The sample follows Alderbrook Digital as it asks its board for £100k to replace three billing tools: 27 months to payback, a five-year NPV of £142k at 3.5% and a benefit-cost ratio of 1.8. Replace the cost of the status quo, the options and the yearly costs, then rerun the plus or minus 20% benefit test.
Click Make a copy in Google Slides, then confirm on the Google page. The copy is saved to your own Google Drive.
Replace the problem slide with the yearly cost of your status quo in pounds, and give each cost line a named owner.
Rebuild the options grid with a do-nothing baseline and two real alternatives, then enter capital, running costs and contingency for each.
Update the comparison table and ROI chart with your own yearly net benefit, and run the plus and minus 20% test on benefits.
Delete the guide slide, then share the deck with your decision-makers or present it.
Yes. The options grid and comparison table both start with a do-nothing baseline, so the finance director can see the cost of waiting beside the two real alternatives.
Start with the annual cost of the status quo, the capital cost with contingency, the yearly running cost and the discount rate. Payback, NPV and the benefit-cost ratio all follow from those.
No. Alderbrook Digital, its people and every figure are fictional sample data, written to add up so you can see how a finished business case reads.
More Google Slides templatesMore project management templates
Docs + Word8 pages
Free
Slides + PowerPoint11 slides
Free
Docs + Word5 pages
Free
Docs + Word8 pages
Free
Docs + Word8 pages
Free
Docs + Word9 pages
Free
Docs + Word2 pages
Free