Annual Report
Docs + Word6 pages
Free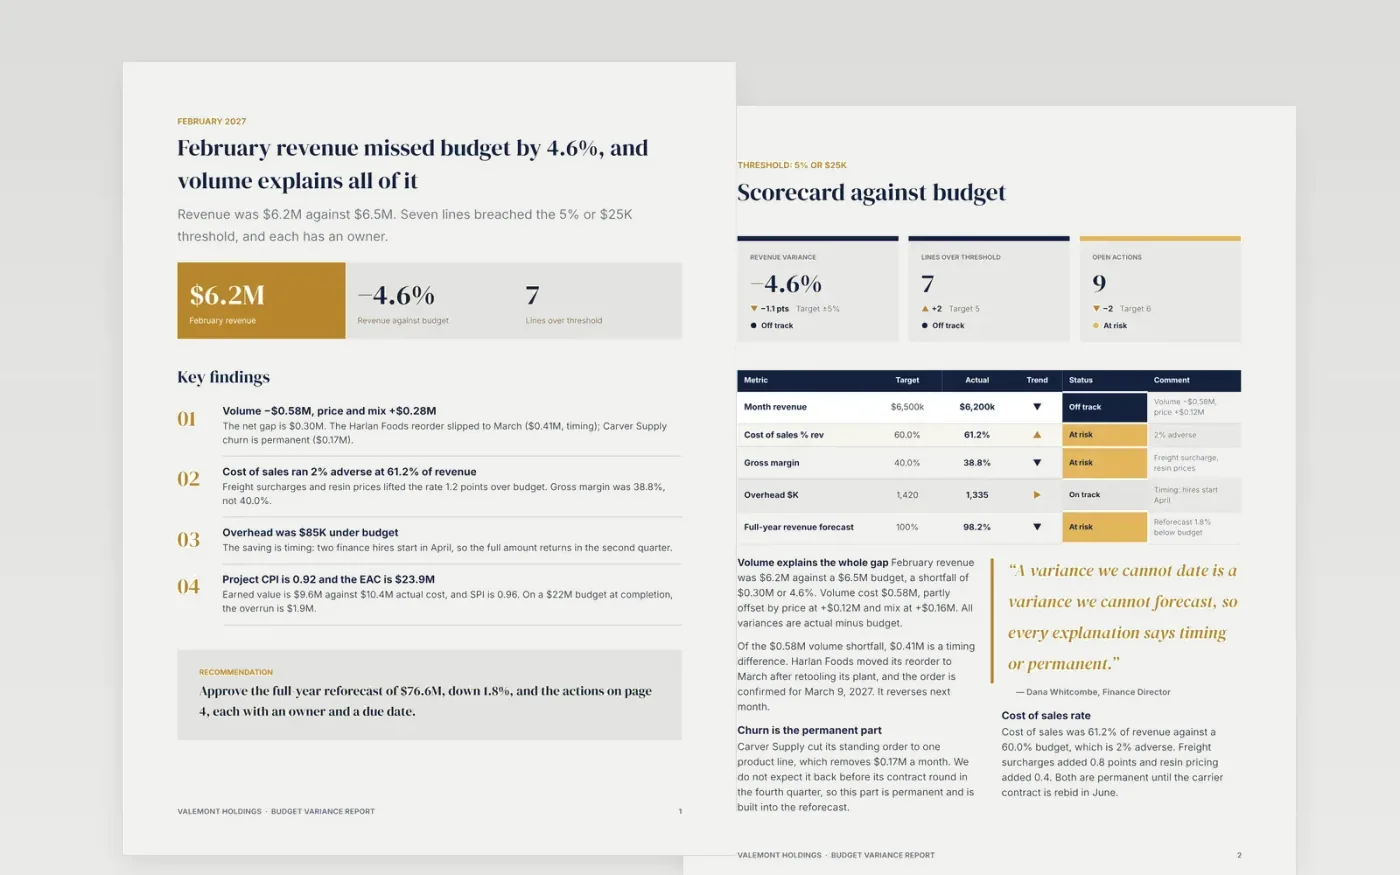
Most variance reports list every line and bury the few that matter. This template starts with the answer, flags only the lines that breach a stated threshold, and gives each material variance a cause, an effect, a timing call and a next step. Six pages: summary, variance table, explanations, actions, forecast impact and a short guide.
The sample is a February 2027 report for Valemont Holdings: revenue $6.2M against a $6.5M budget, split into price, volume and mix, plus cost of sales, an overhead timing saving and an earned value check on a $22M project. Replace the threshold, the budget and actual columns, and each explanation with your own.
Click Make a copy in Google Docs, then confirm on the Google page. The copy is saved to your own Google Drive.
Set the percent and dollar threshold that decides which variances get an explanation, and update the key on the variance table page.
Paste your budget, actual and forecast figures, then write each material variance as cause, effect, timing and action.
Update the full-year forecast, show the movement from last month, and give every action an owner and a date.
Delete the guide page, then share the document or present it at your review meeting.
Only those above your threshold. The sample uses 5% or $25K, whichever is breached first. Lines under the limit stay in the table without commentary so the material ones stand out.
Yes. Both are optional. Remove the project lines from the table and summary if you have no projects, or the price, volume and mix split if it does not fit your business.
No. Valemont Holdings, its people and every figure are fictional sample data, written so the numbers add up and the page shows what good commentary looks like.
Docs + Word6 pages
Free
Docs + Word17 pages
Free
Excel
Free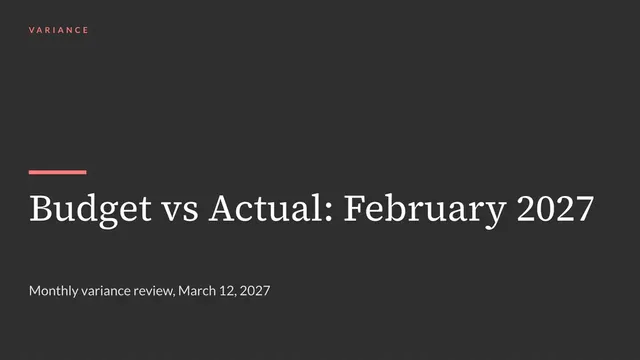
Slides + PowerPoint11 slides
Free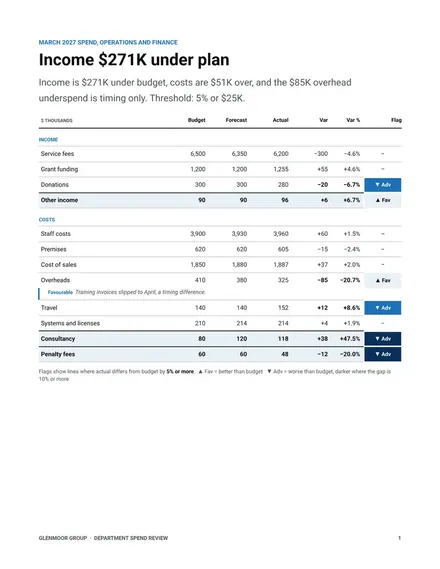
Docs + Word6 pages
Free