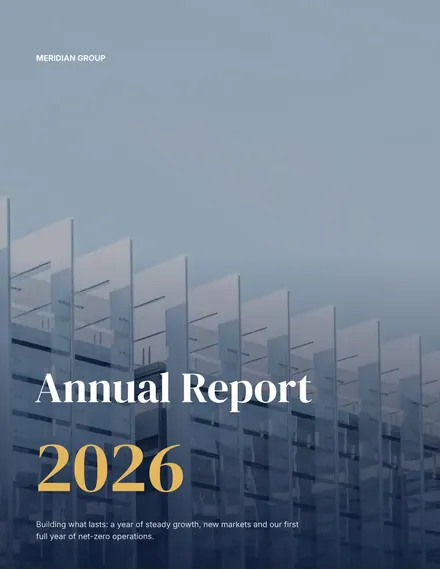
Annual Report
Docs + Word6 pages
Free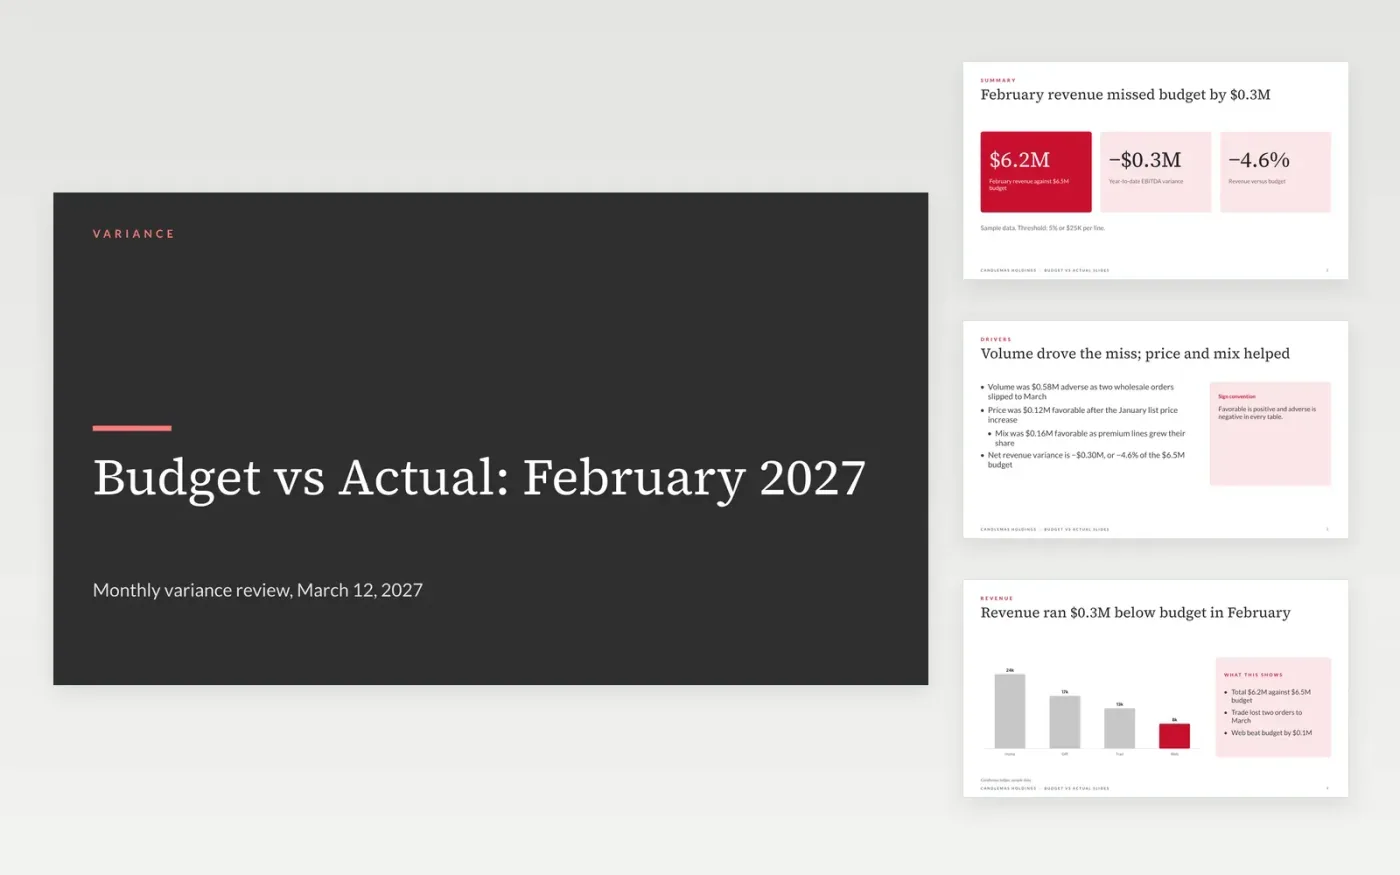
Variance reviews go wrong when every line is explained and the material ones get lost. This deck leads with the headline variance, shows revenue and costs in charts, breaks the gap into volume, price and mix, and finishes with four actions that each have an owner and a date.
The sample is a fictional February 2027 review for Candlemas Holdings: revenue of $6.2M against a $6.5M budget, a 5% or $25K threshold and a full-year forecast down 1.8%. Replace the figures, the threshold and the causes with your own, and keep one sign convention throughout.
Click Make a copy in Google Slides, then confirm on the Google page. The copy is saved to your own Google Drive.
Set your variance threshold in percent and dollars, and replace the headline numbers on the summary slide.
Paste your own revenue and cost figures into the charts and the table, keeping favorable positive and adverse negative.
Rewrite each material variance as cause, effect, timing and action, then update the bridge and the forecast.
Delete the Make it yours guide slide, then share the deck or present it.
Set a threshold, such as 5% or $25K, and explain only lines beyond it. The sample uses that rule so the deck stays short and the material variances stand out.
No. Candlemas Holdings, the people, the email address and every figure are fictional sample content. Replace them with your own budget, actuals and forecast.
It breaks the revenue variance into volume, price and mix so the pieces add up to the total. If your business does not sell units, replace them with your own drivers.
Docs + Word6 pages
Free
Excel
Free
Sheets + Excel4 slides
Free
Docs + Word6 pages
Free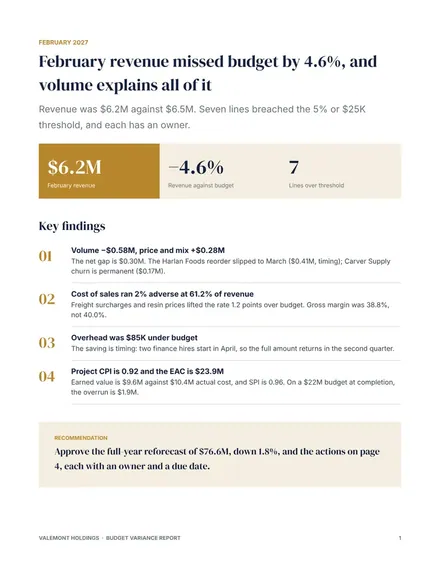
Docs + Word6 pages
Free