Consulting Presentation
Slides + PowerPoint12 slides
Free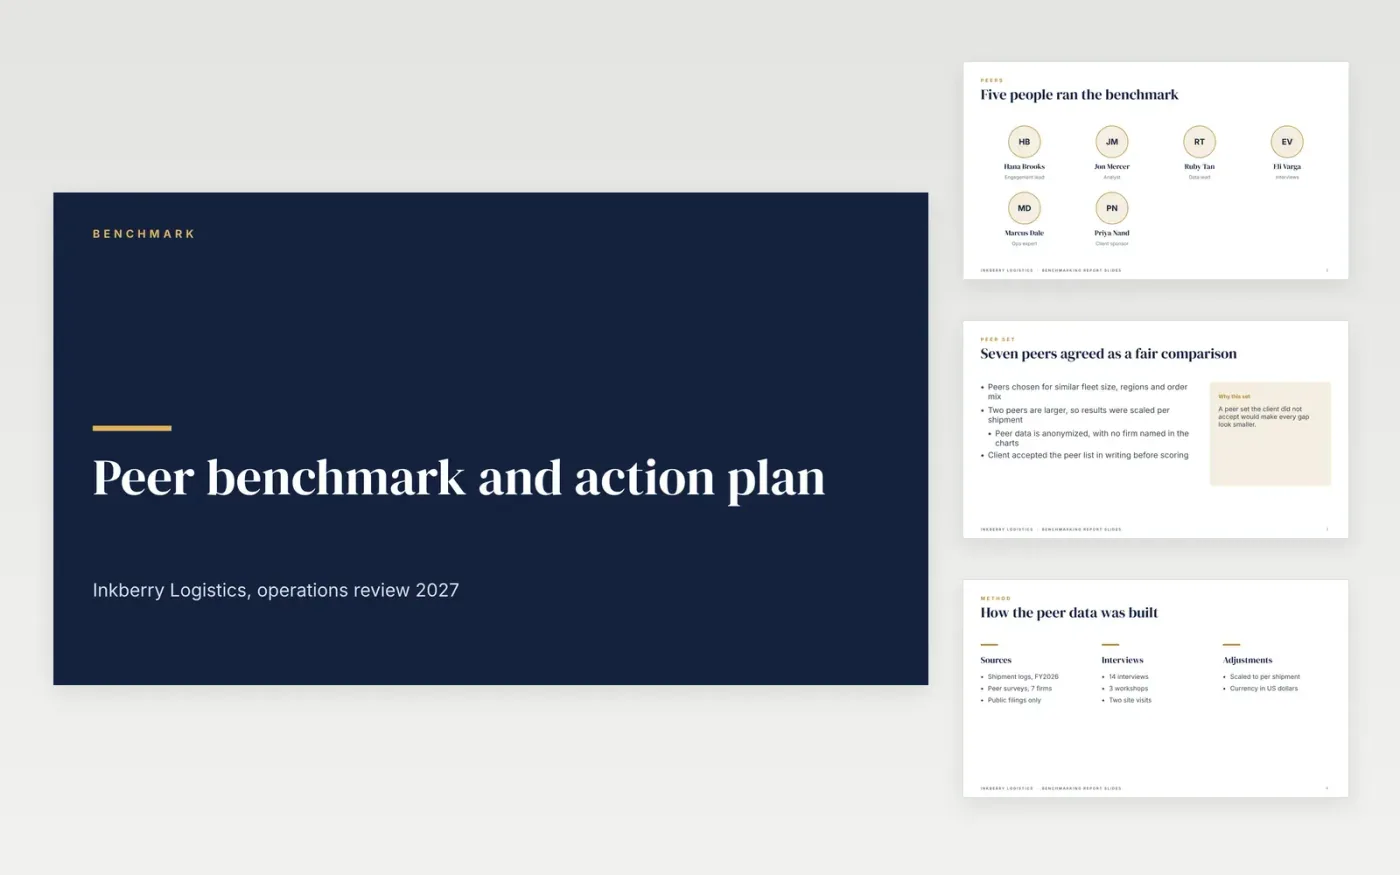
A client who commissions a peer comparison wants a clear answer, not a pile of charts. This Google Slides deck runs from the peer group and the measures through the gaps to the recommendations, with action titles that state each conclusion. A reader who only scans the headings should still know what was found and what to do next.
The sample follows Inkberry Logistics, a fictional regional carrier whose order-to-ship time runs 27% above the peer median. Its peer set, interview counts, benefit case and fixes are invented sample data. Replace them with your own shipment logs and peer data, and rewrite the executive summary once the numbers are checked.
Click Make a copy in Google Slides, then confirm on the Google page. The copy is saved to your own Google Drive.
Replace the peer group with your own list and confirm the client accepts it in writing.
Swap each finding for your observation, evidence source and rating before you edit the charts.
Rebuild the recommendations with benefit, cost, effort and owner, then check the totals add up.
Delete the guide slide, then share the deck with the sponsor or present it to the board.
Five to ten is a workable range. Fewer than five makes a median easy to distort, and more than ten usually adds effort without changing the story. Agree the list with the client before scoring.
No. Inkberry Logistics, its team, the peers, interview counts, benefit figures and fixes are fictional sample data. Replace them with your own engagement results before you use the deck.
Yes. The sponsor reads it first, so write it last but place it at the front. Keep it to three messages the sponsor can repeat, each tied to a number in the findings.
More Google Slides templatesMore business operations templates
Slides + PowerPoint12 slides
Free
Slides + PowerPoint11 slides
Free
Slides + PowerPoint10 slides
Free
Slides + PowerPoint11 slides
Free
Docs + Word7 pages
Free
Docs + Word7 pages
Free
Docs + Word7 pages
Free
Docs + Word9 pages
Free