Nonprofit Finance Report Slides
Slides + PowerPoint11 slides
Free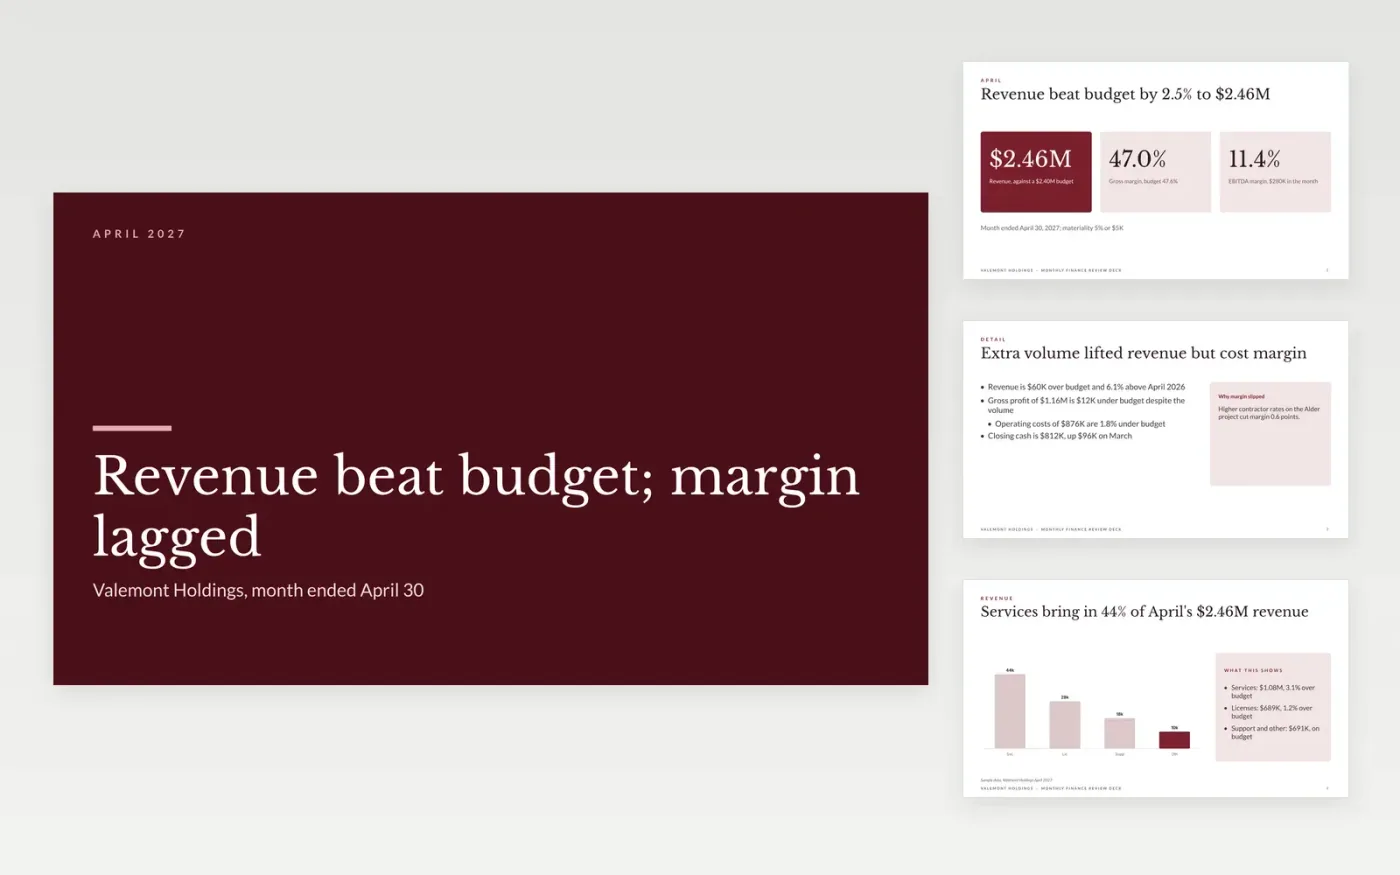
Leaders want to know where the business stands at month end, and most finance packs bury the answer in tables. This deck leads with the headline numbers, then explains revenue, the gross margin gap to budget, costs and cash, and closes with dated actions for the next close.
The sample follows Valemont Holdings for April 2027: revenue of $2.46M, 2.5% over budget, a gross margin of 47.0% and cash of $812K. Replace the period, the KPIs, the segment shares and the variance table with your own trial balance totals, and set your own materiality threshold.
Click Make a copy in Google Slides, then confirm on the Google page. The copy is saved to your own Google Drive.
Set the period end on the cover and replace the headline KPIs with your own revenue, margin, EBITDA and cash.
Paste your trial balance totals into the chart and table, keeping the budget and prior-year comparisons.
Write commentary only for lines that breach your materiality threshold, and update the outlook dates.
Delete this guide slide, then share or present your deck.
Yes. Make a copy in Google Slides and it is yours to edit, with no sign-up here and no cost.
No. Valemont Holdings, the people and every figure are fictional and made up for the example. Replace them with your own before you share the deck.
The sample explains any variance over 5% or $5K. Change the threshold on the table slide to match your own policy, then comment only on lines that breach it.
Slides + PowerPoint11 slides
Free
Slides + PowerPoint10 slides
Free
Slides + PowerPoint11 slides
Free
Slides + PowerPoint11 slides
Free
Docs + Word7 pages
Free
Docs + Word7 pages
Free
Docs + Word8 pages
Free
Docs + Word9 pages
Free
Docs + Word9 pages
Free
Docs + Word9 pages
Free