Monthly Management Accounts
Docs + Word8 pages
Free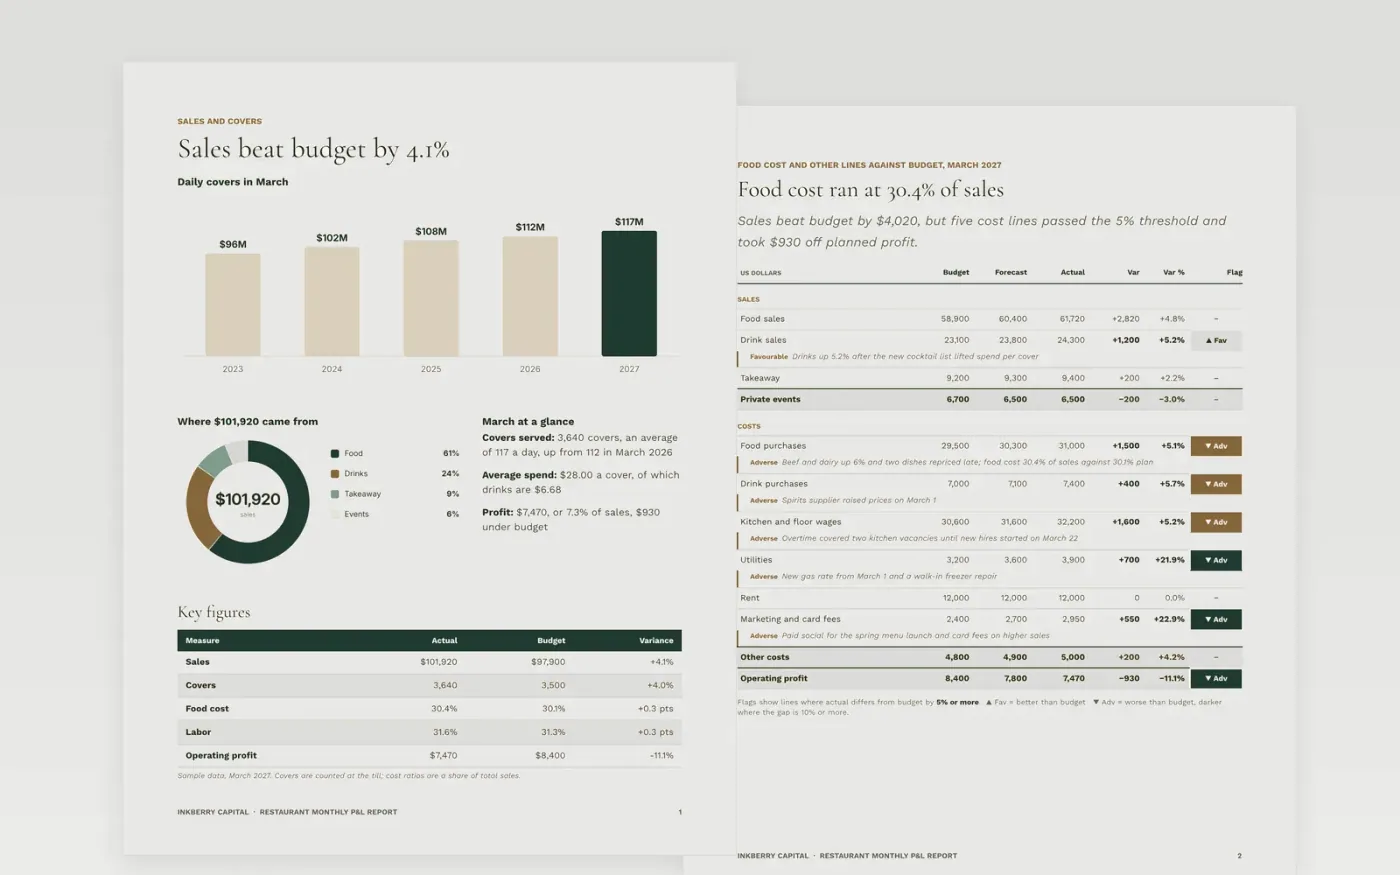
Many restaurant owners see a profit figure at month end but not why it moved. This report shows sales and covers, food cost, labor, overheads and profit against budget and last year, and gives a cause for every line that breaks a 5% or $5K threshold.
The sample follows The Salt Table, a fictional restaurant owned by Inkberry Capital, for March 2027: $101,920 of sales from 3,640 covers, food cost at 30.4%, labor at 31.6% and operating profit of $7,470. Replace the figures with your own, set your threshold, and keep only the actions you will own.
Click Make a copy in Google Docs, then confirm on the Google page. The copy is saved to your own Google Drive.
Paste your sales, covers and cost totals into the key figures table, variance table, overheads table and income statement.
Update the charts with your own months, then keep a written cause only for lines that pass your threshold.
Replace the people, owners, dates and actions with your own team, and delete any action you will not take.
Delete the Make it yours guide page, then share the report with your owners and managers.
They sit inside common ranges, with food cost near 30% and labor near 32% of sales, but your own menu, rent and staffing will differ. Replace them with your actuals.
Yes. Make one copy per site, or add the site name to each heading. Keep the same threshold and layout so results can be compared month to month.
No. Inkberry Capital, The Salt Table, the people and every figure and email address in the sample are fictional and exist only to show what a finished report looks like.
Docs + Word8 pages
Free
Docs + Word8 pages
Free
Docs + Word6 pages
Free