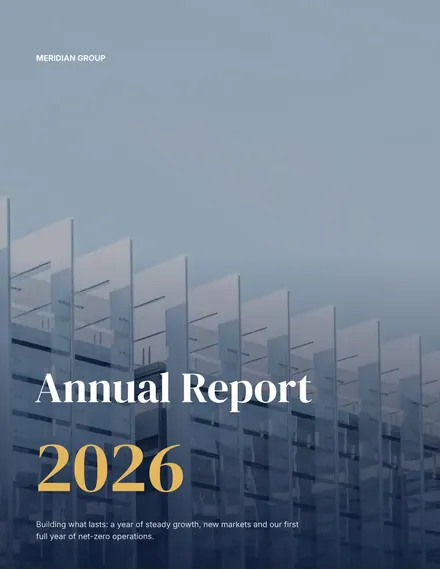
Annual Report
Docs + Word6 pages
Free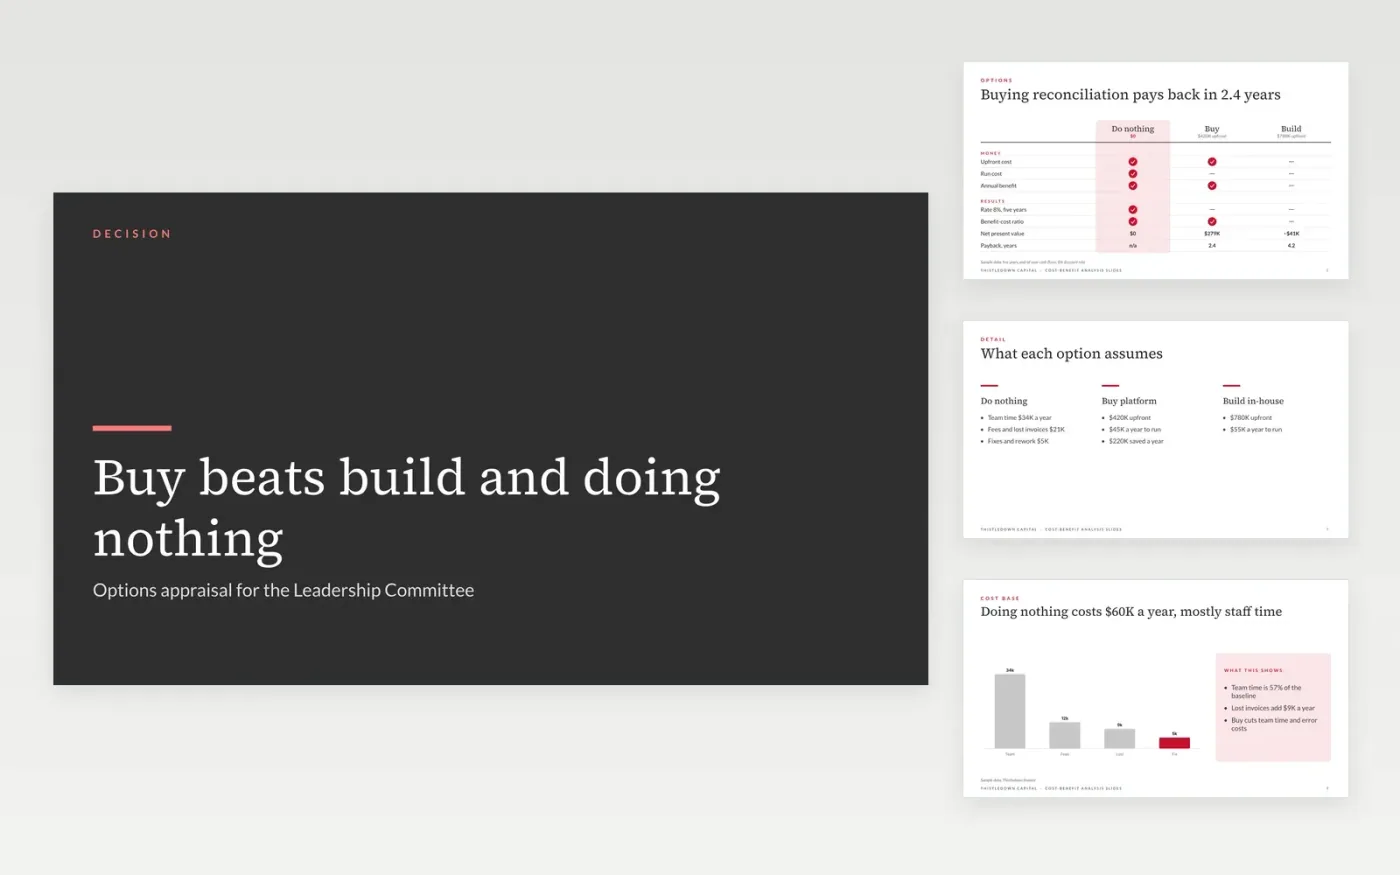
Leadership committees often choose between options whose costs and benefits arrive in different years. This deck puts every option on the same five-year timeline at one discount rate, and compares them by net present value, payback and benefit-cost ratio. It keeps the do-nothing option costed, so no choice looks positive just because the baseline was ignored. The slides run in order: options, costs, benefits, scorecard and recommendation.
The sample weighs a $420K licensed platform against a $780K in-house build and doing nothing. Buying returns an NPV of $279K and pays back in 2.4 years, while building is negative at −$41K. The sensitivity check flips the choice when benefits fall 20% and costs rise 20% together. To use it, replace the sample options, costs and benefits with your own figures, keep the discount rate and five-year horizon from your finance policy, and record the source for each benefit.
Click Make a copy in Google Slides, then confirm on the Google page. The copy is saved to your own Google Drive.
Replace the decision, options and five-year horizon on the cover, then enter costs by year for each option, including do nothing.
Enter each benefit with its evidence, then discount at your policy rate and check the NPV and payback.
Run the sensitivity at benefits minus 20% and costs plus 20%, then note where the choice flips on the scorecard.
Delete this guide slide, then share the deck or present it from Google Slides.
No. Thistledown Capital, its people, the option costs and the benefit figures are fictional sample data. Replace every figure with your own evidence before you use the deck.
Yes. Choose the options, costs and benefits that match your case, then keep the same horizon and discount rate for every option so the comparison is fair.
The do-nothing option shows the cost of carrying on as things are. Without it, every option can look positive even when staying put is the most expensive choice.
Docs + Word6 pages
Free
Excel
Free
Sheets + Excel4 slides
Free
Docs + Word8 pages
Free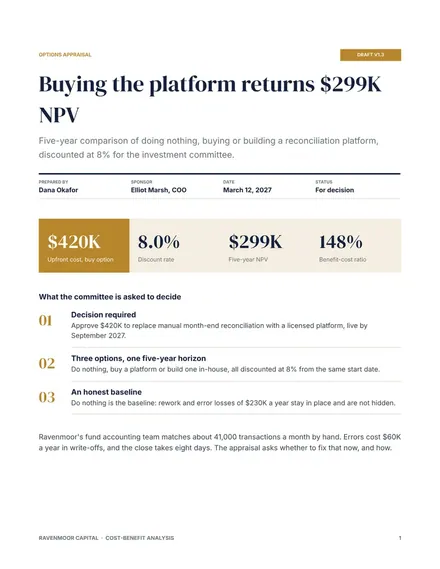
Docs + Word8 pages
Free