Annual Report
Docs + Word6 pages
Free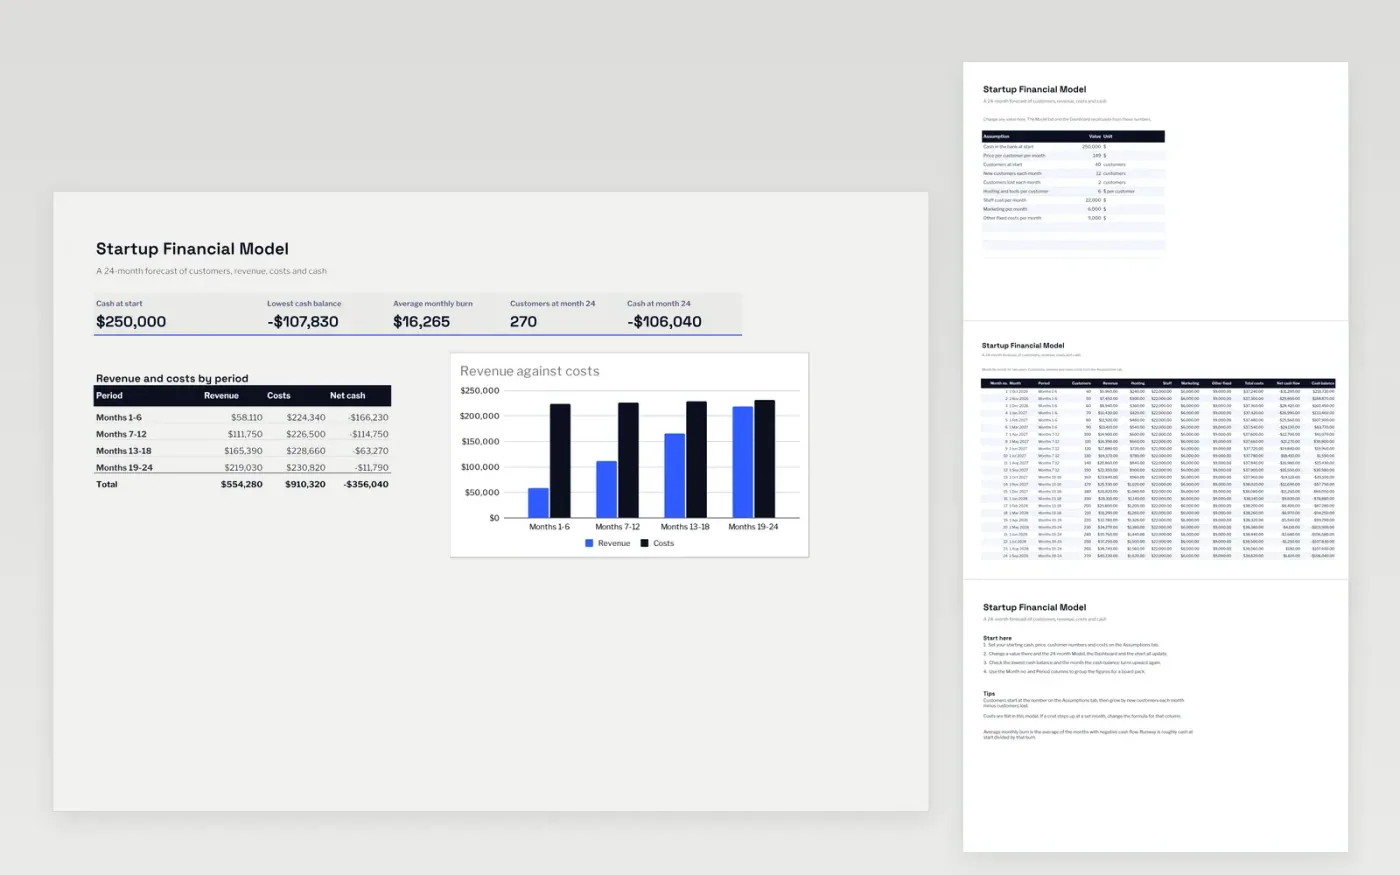
A two-year financial model for an early-stage company. The Assumptions tab holds the starting cash, price, customer numbers and monthly costs. The Model tab builds 24 months of customers, revenue, costs, net cash flow and cash balance, and the Dashboard shows the lowest cash balance, average burn and a chart by period.
It comes with sample data for a small software start-up. Make a copy and replace the assumptions. The monthly model, runway figures and chart update on their own.
Click Make a copy in Google Sheets, then confirm on the Google page. The copy is saved to your own Google Drive.
Start on the Assumptions tab: replace the sample rows with your own.
Keep the formula columns as they are; they fill in as you type.
Read the How to use tab for tips. For Excel, download the .xlsx file instead.
Yes. Download the template and use it at no cost for your own planning.
Yes. Download the .xlsx file and open it in Excel. The formulas and charts work there too.
Look at the cash balance column on the Model tab. The Dashboard shows the lowest balance and the average monthly burn. Dividing the cash at start by the burn gives a rough runway.
Docs + Word6 pages
Free
Excel
Free
Sheets + Excel4 slides
Free
Sheets + Excel5 slides
Free
Sheets + Excel3 slides
Free