Annual Report
Docs + Word6 pages
FeaturedFree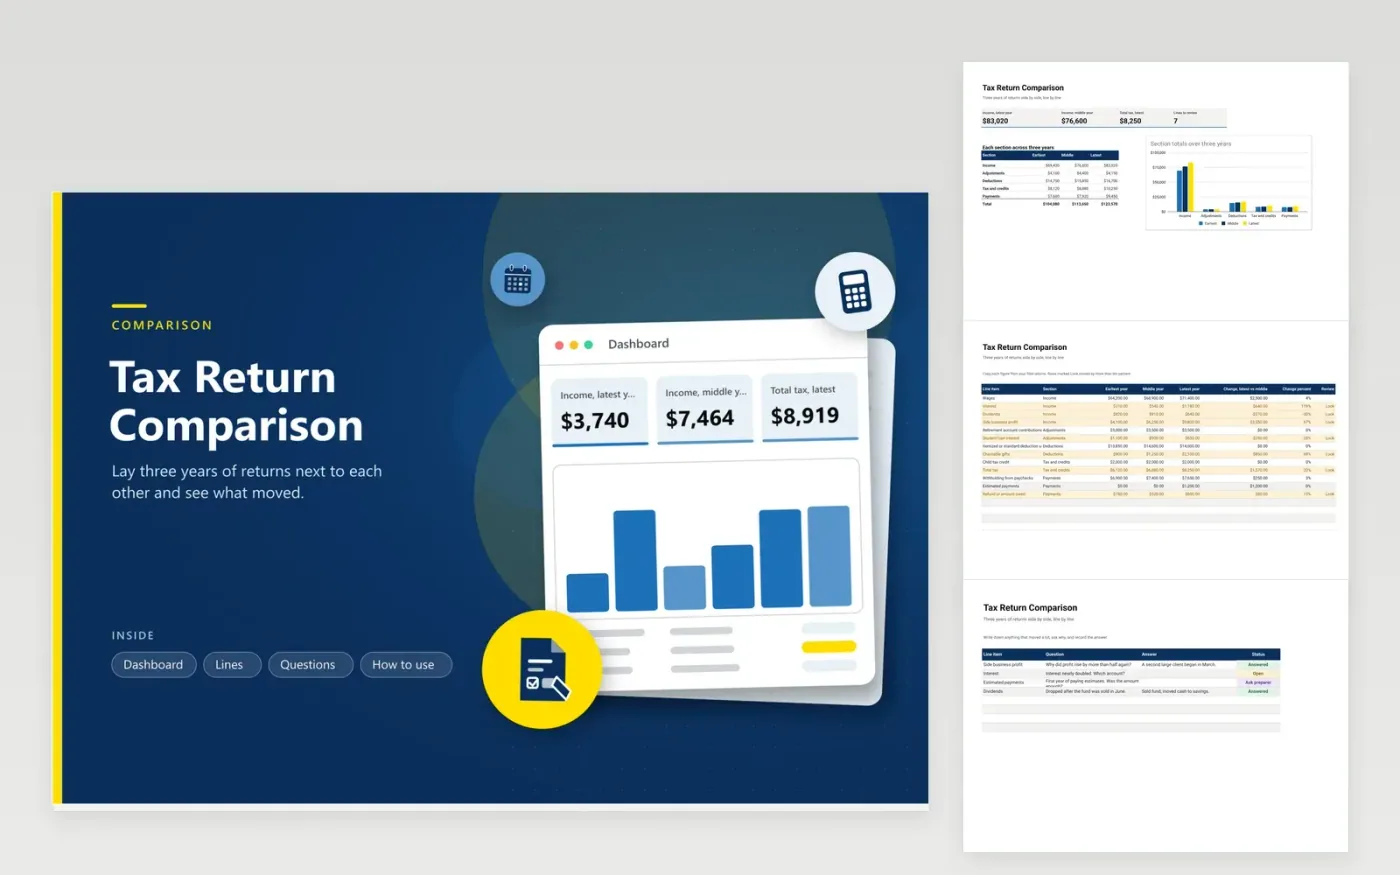
Anyone who files every year and wonders why the result changed can use this comparison. The Lines tab holds one row per line item with a figure for each of three years, the change between the two latest years, the change as a percent and a Look flag when the move is large. The Questions tab records what to ask about each flagged line. The Dashboard totals each section for all three years in a column chart.
Start by copying figures from the returns you already filed, using your own labels for the lines. Group them into sections so income, deductions, tax and payments stay apart. When a row turns amber, write a question on the Questions tab and fill in the answer once you know it. A short written reason for each change makes next year's filing calmer.
Click Make a copy in Google Sheets, then confirm on the Google page. The copy is saved to your own Google Drive.
Start on the Lines tab: replace the sample rows with your own.
Keep the formula columns as they are; they fill in as you type.
Read the How to use tab for tips. For Excel, download the .xlsx file instead.
Put the same line items in rows and each year in its own column, as the Lines tab does. Then read the change columns. Use your own labels, since form line numbers can move between years.
Common causes are different income, withholding that no longer matches earnings, or a credit that changed. Compare the Income, Payments and Tax and credits sections here, and raise anything unclear with your tax professional.
Keep filed returns for as long as current IRS guidance says you may be asked about them. Three years of side-by-side figures is a handy working view, yet it cannot stand in for the saved returns.
Docs + Word6 pages
FeaturedFree
Excel
FeaturedFree
Sheets + Excel6 tabs
Free