Annual Report
Docs + Word6 pages
FeaturedFree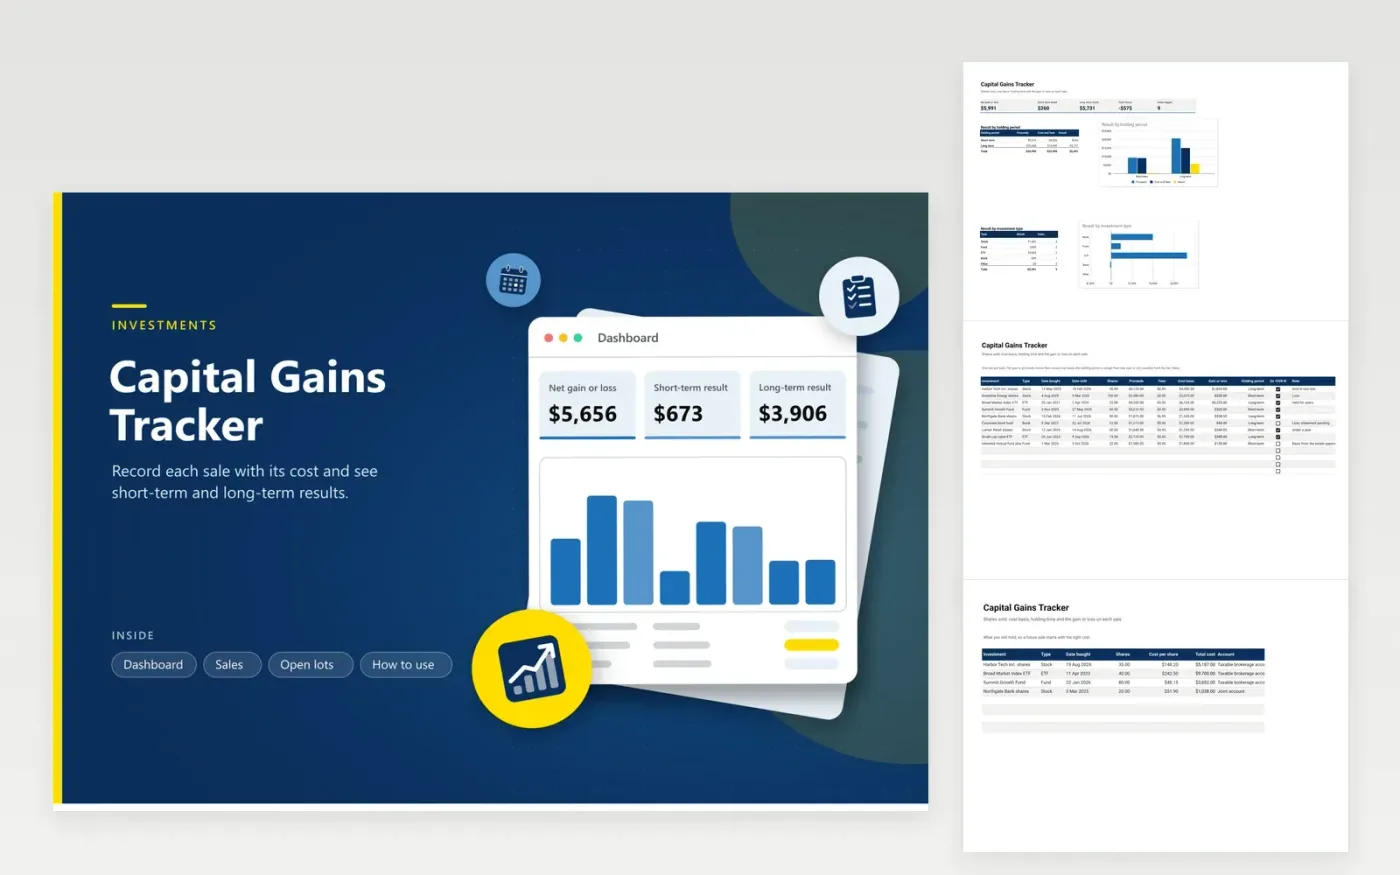
Investors who sell shares, funds or ETFs during the year use this capital gains tracker to keep every sale in one list. The Sales tab gives each sale a row with dates, proceeds, fees and cost basis, and it calculates the gain or loss and whether the holding period was longer than a year. The Open lots tab records what you still own. The Dashboard totals gains and losses and shows results by holding period and by investment type.
Fill in the cost basis from your broker's statement, and add a note when you inherited or were gifted an asset, because the basis may follow different rules. Tick the 1099-B box when the form arrives so you can see which sales are still missing from it. Treat the sheet as a record, then ask a tax professional how gains and losses combine on your return.
Click Make a copy in Google Sheets, then confirm on the Google page. The copy is saved to your own Google Drive.
Start on the Sales tab: replace the sample rows with your own.
Keep the formula columns as they are; they fill in as you type.
Read the How to use tab for tips. For Excel, download the .xlsx file instead.
Subtract the cost basis and any selling fees from the proceeds. A positive number is a gain and a negative one a loss. The Gain or loss column does this for each row and the Dashboard adds the rows.
It depends on how long you held the investment before selling. The sheet counts the days between the two dates and labels the sale Short-term or Long-term. Read the latest rules to see how each is taxed, or consult a tax professional.
Keep trade confirmations, year-end broker statements and the 1099-B. Note the purchase date and cost of each lot. This sheet holds the figures in one place beside those documents.
Docs + Word6 pages
FeaturedFree
Excel
FeaturedFree
Sheets + Excel6 tabs
Free