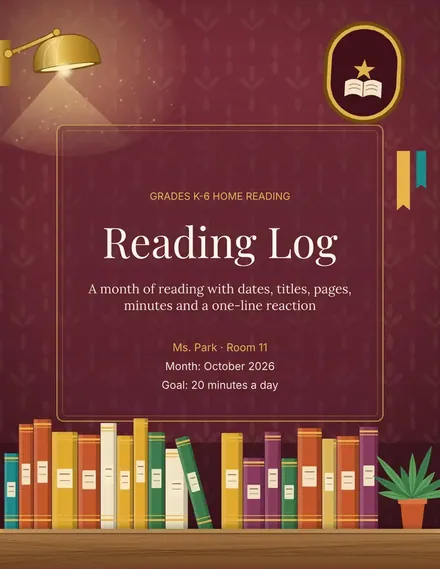
Reading Log
Docs + Word3 pages
Free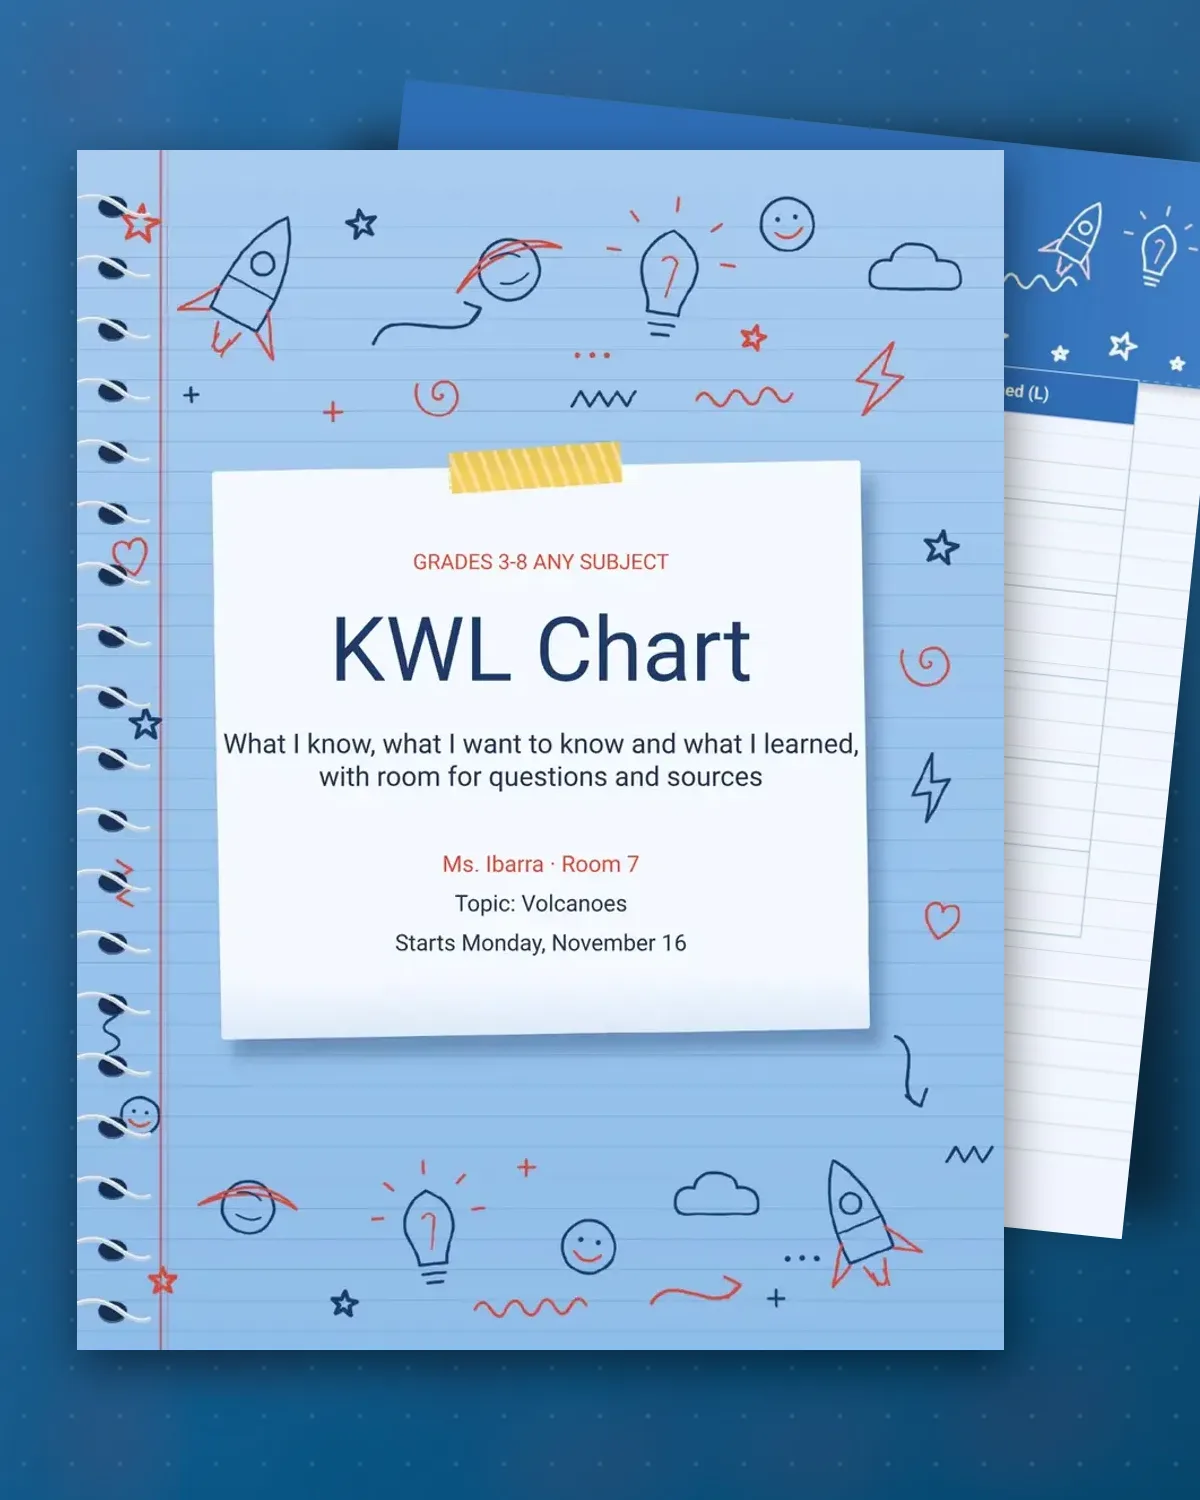
A KWL chart shows what students already believe about a topic before a unit begins, and what they hope to learn. The first two columns are filled in before the lesson. The third column is completed after, so students can see how much they learned and which questions still need research.
The sample starts a unit on volcanoes for a fourth-grade class, with three statements in the know column and two questions in the want column. The second page is a research table that lists each question, where to look and whether the answer was found, along with a sources box. Use the same layout for any new topic.
Make a copy in Google Docs, or download the Word file.
Type over the sample text with your own details.
Delete the guide page when you are done.
Print it, or save it as a PDF.
After the lesson or unit ends. Students can add to the learned column on the day of the lesson, so the chart shows the change in understanding.
No. It works in history, reading and math. Change the topic at the top and use the want column for questions about any unit.
Yes, that is the purpose of the sources box. Students write the book, website or video they used for each answer.
Docs + Word3 pages
Free
Docs + Word3 pages
Free
Docs + Word3 pages
Free
Docs + Word3 pages
Free
Docs + Word3 pages
Free
Docs + Word3 pages
Free
Docs + Word3 pages
Free
Docs + Word3 pages
Free
Docs + Word3 pages
Free
Docs + Word3 pages
Free
Docs + Word3 pages
Free
Docs + Word3 pages
Free
Docs + Word3 pages
Free
Docs + Word3 pages
Free
Docs + Word3 pages
Free