Class Attendance Sheet
Sheets + Excel4 slides
Free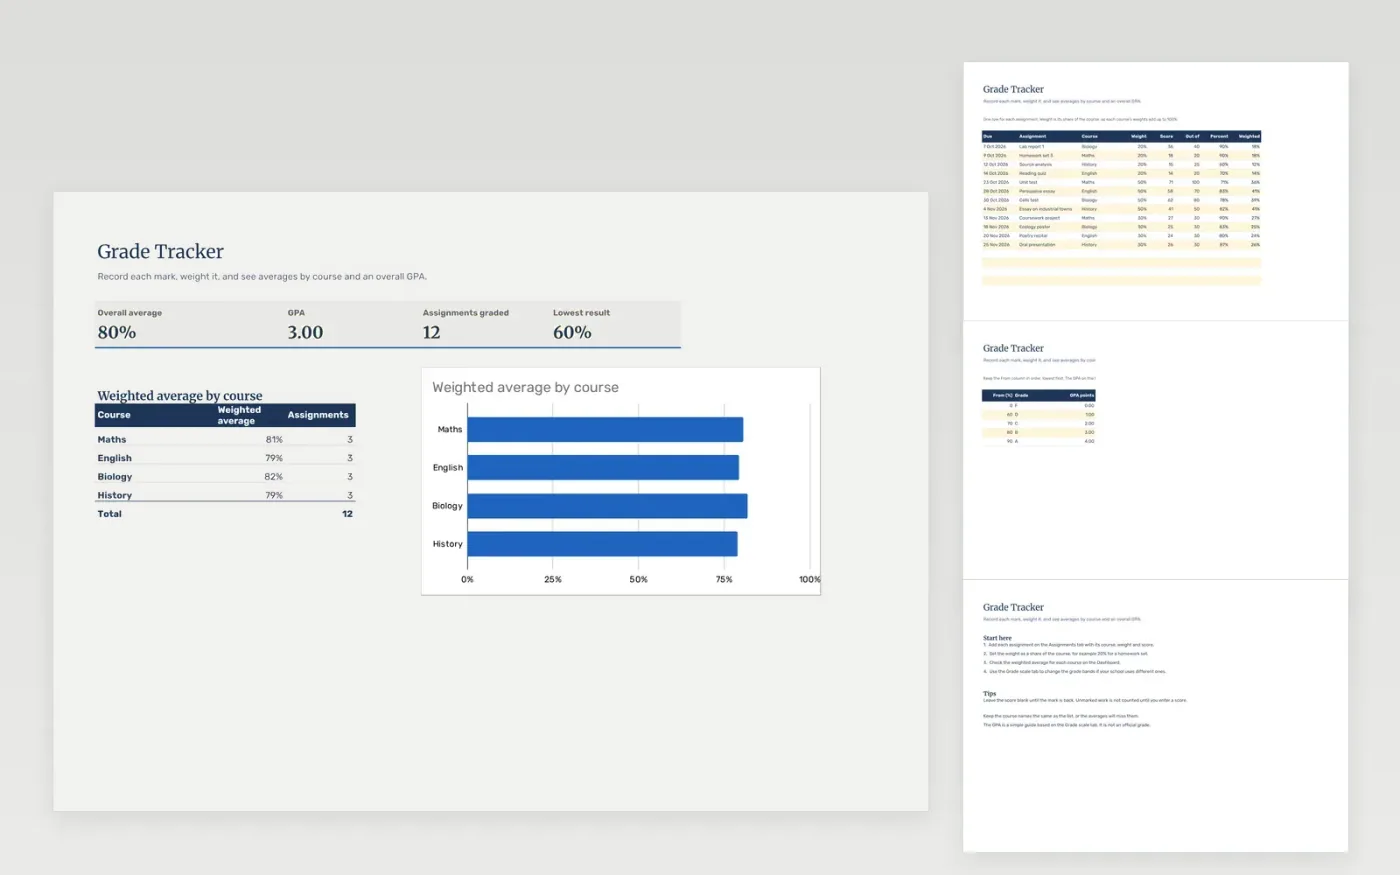
This template tracks marks across several courses. The Assignments tab has one row for each piece of work, with its course, weight, score and maximum mark. The percent and weighted columns are worked out for you. The Grade scale tab holds the grade bands used for the GPA.
The Dashboard shows the overall average, the GPA, the number of assignments graded and the lowest result, with a chart of the weighted average by course. It comes with sample data. Make a copy, then replace the sample rows. Formulas and charts update on their own.
Click Make a copy in Google Sheets, then confirm on the Google page. The copy is saved to your own Google Drive.
Start on the Assignments tab: replace the sample rows with your own.
Keep the formula columns as they are; they fill in as you type.
Read the How to use tab for tips. For Excel, download the .xlsx file instead.
Yes. Download the template and use it in Google Sheets or Excel at no cost.
Yes. Download the .xlsx file to open it in Excel. The formulas and charts work in both Excel and Google Sheets.
No. It is a simple guide based on the grade bands you set on the Grade scale tab. Use your school's own rules for official results.
Sheets + Excel4 slides
Free
Sheets + Excel4 slides
Free
Sheets + Excel5 slides
Free