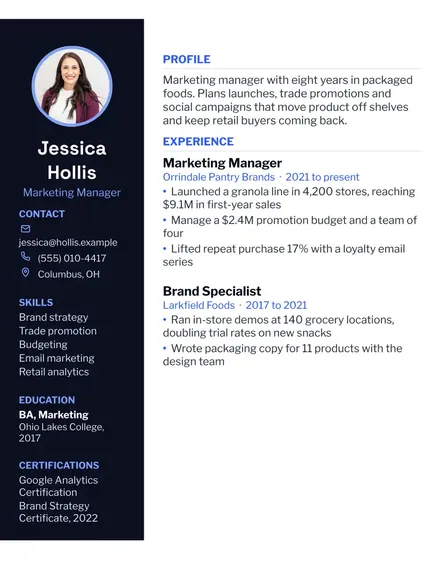
Modern Resume
Docs + Word1 page
Free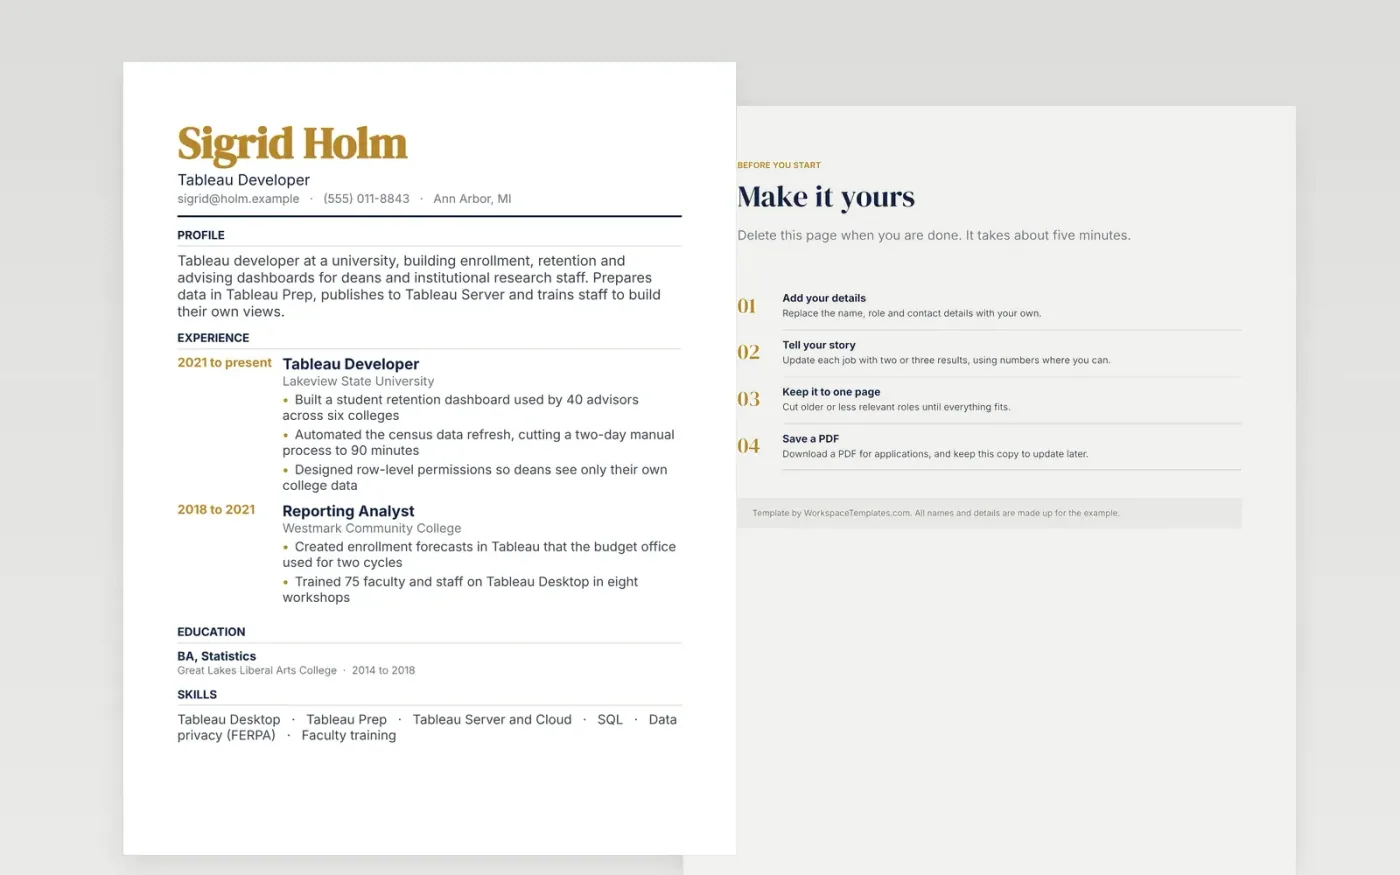
Universities evaluate Tableau developers on dashboards people actually use and on careful handling of student records. They look for published views with a real audience, row-level permissions matching college or department structures, and data preparation a non-technical team can repeat. Tableau Desktop Certified Associate helps but seldom settles the choice alone. Dated entries list each role and project in yearly order, which mirrors how academic and public employers reconstruct a career.
The example developer builds retention and enrollment dashboards for a university, following several years as a reporting analyst at a community college. Substitute your own schools, dashboards and counts, and name the audience each view serves. Tip for this posting: describe training you delivered, since academic panels value people who teach colleagues to use data. Explain how you safeguard student records under FERPA in practice, without reciting the statute.
Make a copy in Google Docs, or download the Word file.
Type over the sample text with your own details.
Delete the guide page when you are done.
Print it, or save it as a PDF.
Tableau Desktop Certified Associate is the most recognized entry credential, and many employers request it by name. Tableau offers other role-based certifications for analysts and developers, so match the one to the posting. Note the year for each, and drop anything that has expired. A published dashboard alongside the certificate shows the skill in action.
List Tableau Desktop, Tableau Prep and the Server or Cloud site where you publish, followed by SQL and the student data rules you observed. Name the audience for each dashboard, such as deans, advisors or budget staff. Attach one outcome to each project, such as hours saved or a retention report that was adopted. Note the training you led and the headcount.
A degree in statistics, mathematics, economics or a related field helps, because academic employers prize analytical method. Many Tableau developers come from institutional research, business or information systems, and those routes are equally common. Show one question you answered with data and how the dashboard supported a decision. Keep the education entry brief.
Docs + Word1 page
Free
Docs + Word1 page
Free
Docs + Word1 page
Free
Docs + Word1 page
Free
Docs + Word1 page
Free
Docs + Word1 page
Free
Docs + Word1 page
Free
Docs + Word1 page
Free
Docs + Word1 page
Free
Docs + Word1 page
Free
Docs + Word1 page
Free
Docs + Word1 page
Free
Docs + Word1 page
Free
Docs + Word1 page
Free
Docs + Word1 page
Free